
 Price: Cup-and-Handle Pattern Projects Possible $300,000 Target by 2026")
TLDR
- Bitcoin’s Bollinger Bands have reached their “most extreme level” since inception, potentially signaling a major price move
- BTC recently climbed above $114,000 following a favorable PPI report showing cooling inflation
- Cup-and-handle pattern suggests a potential target of $300,000 by 2025-2026
- Institutional demand through spot Bitcoin ETFs remains strong with positive inflows
- Federal Reserve expected to cut interest rates with growing speculation of a 50 basis point move
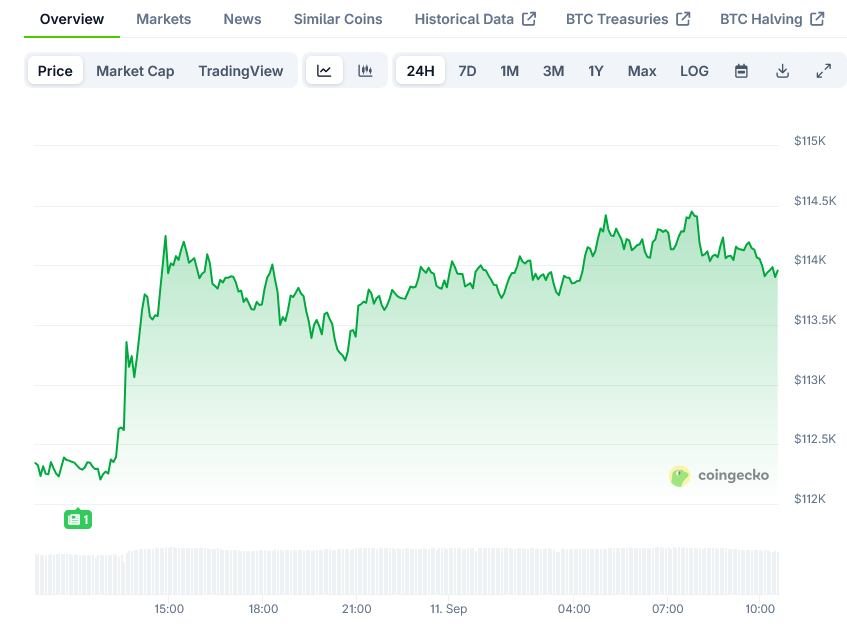
Bitcoin has once again captured market attention as it climbs above $114,000, driven by both technical signals and favorable economic data. The world’s largest cryptocurrency continues to show strength despite recent volatility, with multiple indicators suggesting further upside potential.
BTC rose above $114,000 on Wednesday after the release of the Producer Price Index (PPI) report, which came in below expectations. The PPI fell 0.1% in August, following a 0.7% increase in July, when economists had predicted a 0.3% rise.
This cooling inflation data has increased investor confidence that the Federal Reserve will implement rate cuts in the near future. Markets now expect at least a 25 basis point cut next week, with growing speculation that the Fed might opt for a more aggressive 50 basis point reduction.
The softer PPI print came as a relief to markets that had braced for higher wholesale inflation. Forecasts had projected 3.3% for headline PPI and 3.5% for core PPI, making the actual figures particularly welcome news for risk assets like Bitcoin.
Adding to the dovish economic outlook, the Bureau of Labor Statistics revised nonfarm payrolls down by 911,000 jobs as of March 2025. This revision points to weaknesses in the labor market that could further push the Fed toward monetary easing.
Technical Indicators Flash Bullish Signal
On the technical front, Bitcoin’s Bollinger Bands indicator has reached what traders describe as its “most extreme level” in the monthly time frame since Bitcoin’s creation in January 2009. This compression typically precedes major price movements.
Crypto trader Matthew Hyland highlighted this development, noting that previous contractions in 2012, 2016, and 2020 all “preceded explosive price expansions.” The current setup is even tighter than historical examples, potentially indicating the largest price move ever seen for BTC.
#BTC Monthly Bollinger Bands now at the most extreme level in its entire history: pic.twitter.com/Lxhe7JYRYu
— Matthew Hyland (@MatthewHyland_) September 8, 2025
Another analyst, Crypto Ceasar, observed that “The Bitcoin Bollinger Bands on the 1M (monthly) are at historical tightness,” adding that “This has previously led to heavy volatility to the upside. Bitcoin could be in for a spicy Q4.”
A similar squeeze on the three-day chart in early July preceded Bitcoin’s run to its current all-time high above $124,500, which was reached on August 14.
The monthly chart reveals that Bitcoin’s price broke above the cup-and-handle neckline at $69,000 in November 2024. The cryptocurrency is still validating this breakout and could rise to complete the maximum distance between the cup’s trough and the neckline.
Path to $300,000
Based on this cup-and-handle pattern, some analysts project a target of approximately $305,000 for Bitcoin by 2025-2026. This would represent a gain of more than 170% from current price levels.
However, it’s worth noting that cup-and-handle patterns don’t guarantee the full projected move. According to veteran analyst Thomas Bulkowski, only about 61% of these setups reach their expected targets.
Bitcoin is currently in what some describe as a classic bull cycle correction phase after reaching all-time highs. This correction may find a bottom around $104,000 before another leg higher begins.
Institutional demand through spot Bitcoin ETFs remains strong, with inflows turning positive on Monday. Market intelligence firm Santiment noted, “Money is moving back into Bitcoin ETFs at a rapid rate as retailers impatiently drop out of crypto.”
Multiple factors are putting Bitcoin in a favorable position for further upside despite recent failed attempts to sustain a recovery above $112,000. These include the impending Fed interest rate cuts, bullish on-chain metrics, and persistent institutional demand.
The Consumer Price Index (CPI) data due tomorrow will provide another key piece of economic information that could influence Bitcoin’s price action. If inflation data continues to soften, Bitcoin may see additional upside momentum in the coming weeks.
Bitcoin is currently trading at $113,940, remaining well-positioned to benefit from the expected shift toward looser monetary policy.

