

Key Takeaways
- Binance Coin declined more than 5%, breaching the critical $600 threshold
- Crude oil prices rocketed beyond $110 amid heightened Middle Eastern conflict, creating downward pressure on digital assets
- Technical indicators reveal three consecutive bearish signals on the 4-hour timeframe pointing to institutional distribution
- Further downside toward $520 remains likely should selling pressure persist
- Daily timeframe RSI indicator has declined beneath 40, reinforcing negative market sentiment
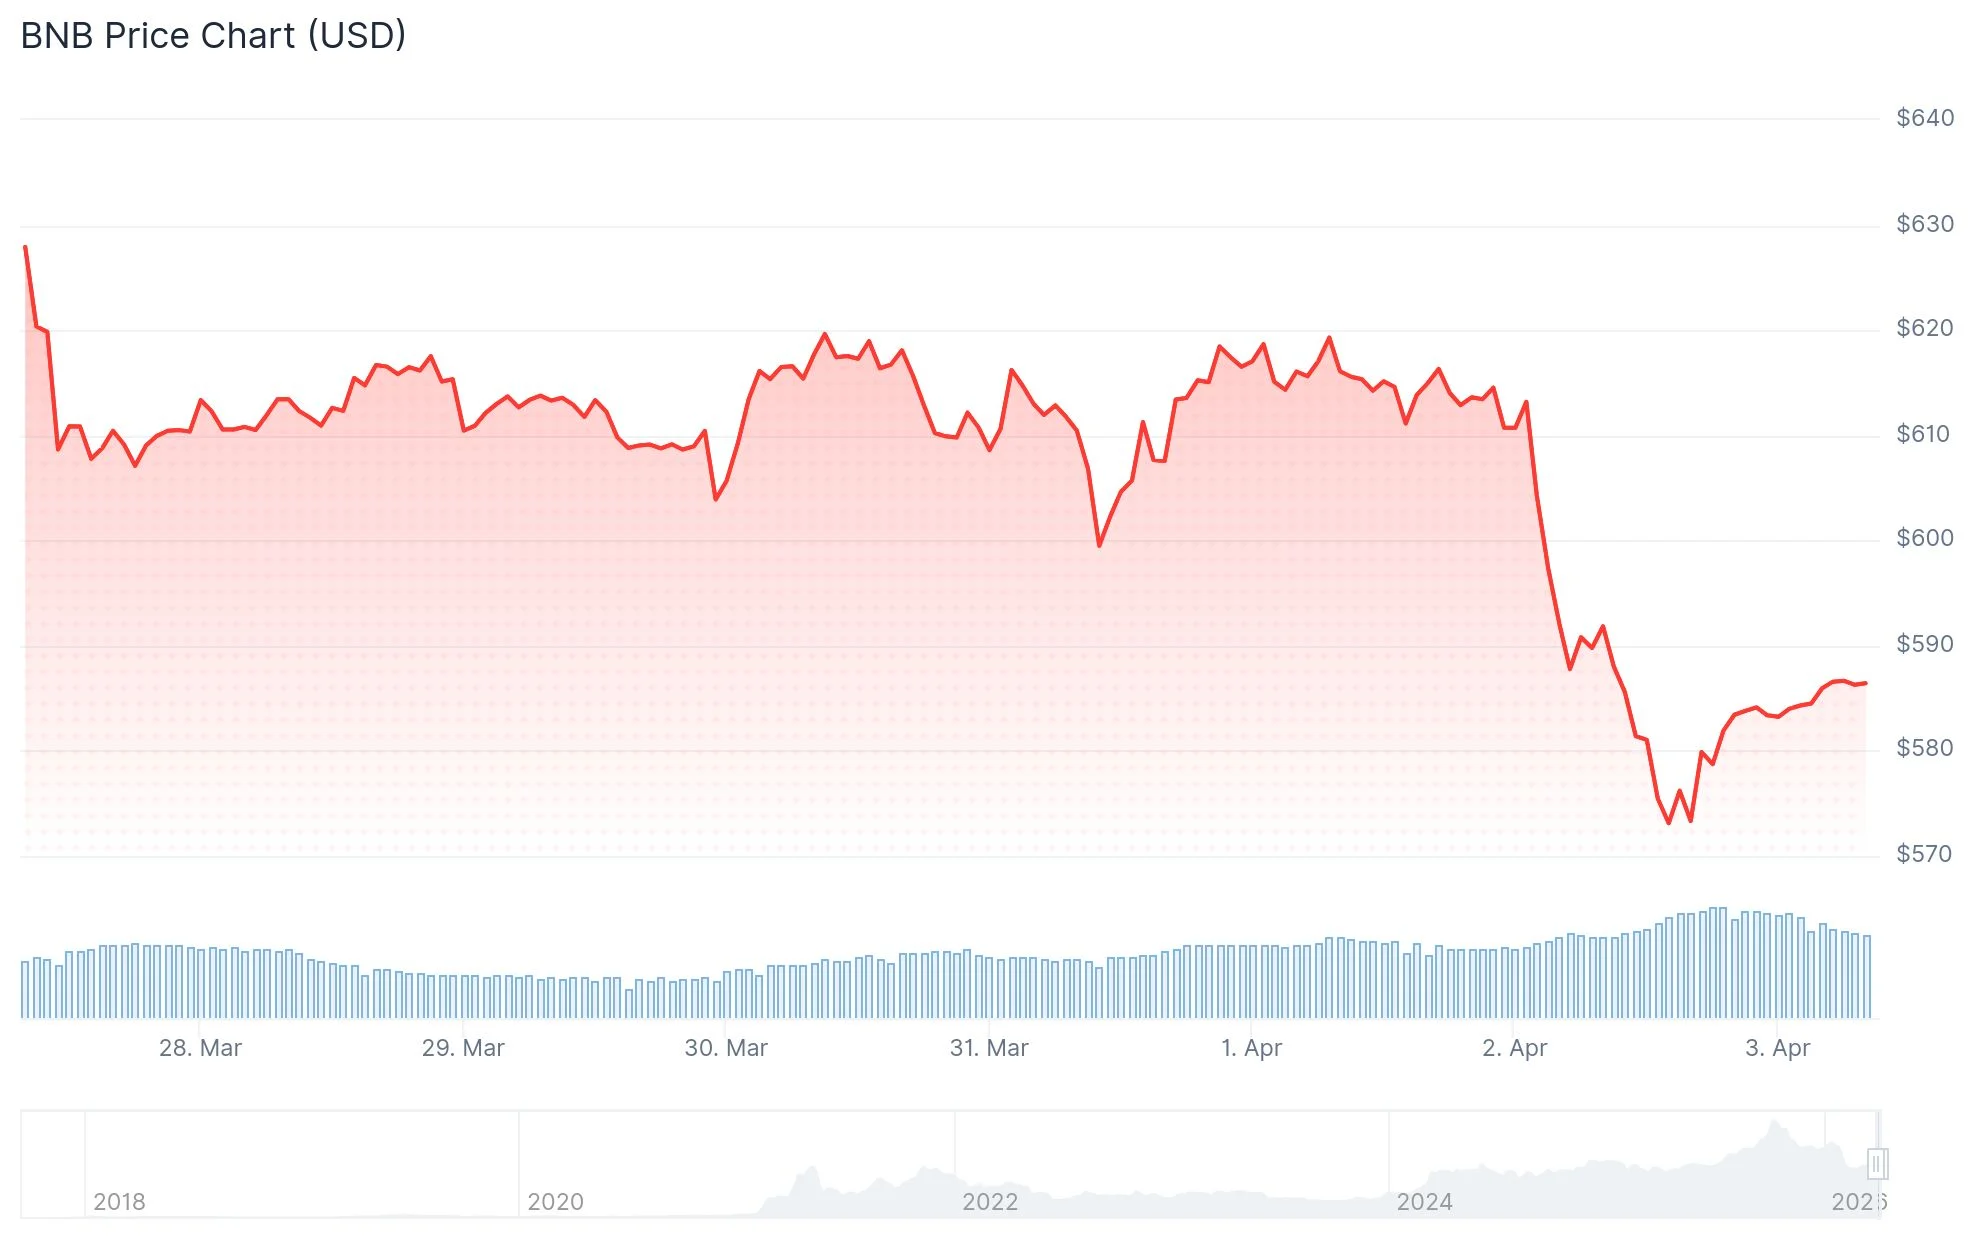
Binance Coin has experienced a sharp decline exceeding 5% during the latest trading session, breaking through the psychologically significant $600 threshold that market participants had been monitoring carefully. The asset momentarily declined to $580 before stabilizing at temporary support.
The widespread liquidation coincides with crude oil valuations surging past $110 per barrel. Following President Trump’s warnings of potential military intervention against Iran regarding Strait of Hormuz access, worldwide financial markets reacted negatively, prompting capital flight from higher-risk investments including cryptocurrencies.
Trading activity for Binance Coin increased 35% throughout the previous 24-hour period as the asset tested the $580 demand region.
Currently positioned at $580, BNB remains 57% below its latest peak of $1,360. This substantial differential highlights the significant distribution that has accumulated throughout recent months.
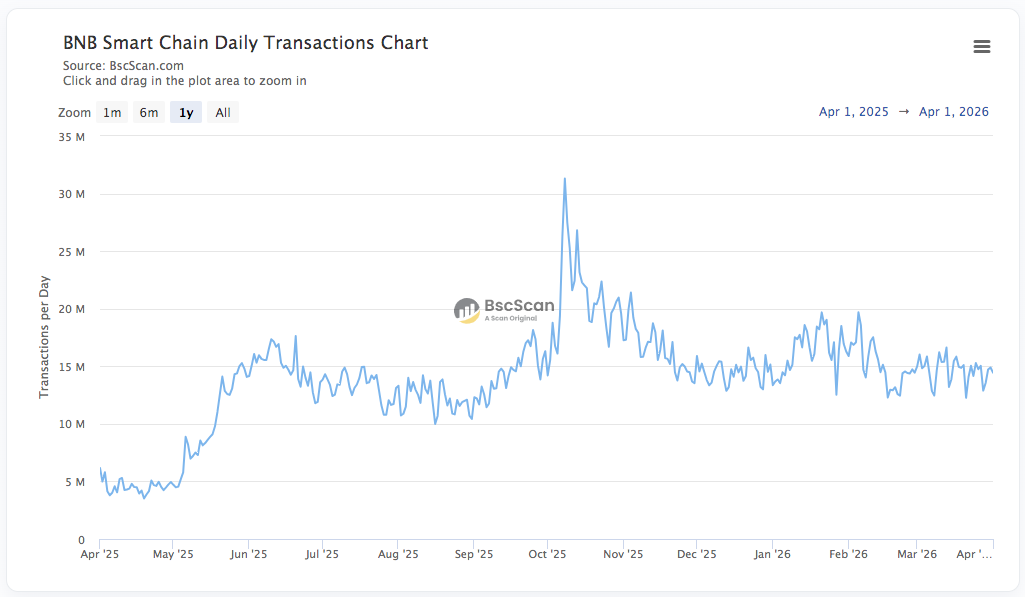
Binance Coin serves two primary functions: providing trading fee reductions on the Binance platform and facilitating transaction expenses on BNB Chain. Network analytics from BSC Scan indicate daily transaction volumes fluctuating between 13 and 19 million, maintaining typical operational levels.
Bearish Momentum Dominates
The daily timeframe analysis reveals BNB has revisited the $580 price level for the third occasion within a two-month period. Multiple returns to identical support zones typically diminishes the probability of an imminent recovery.
The Relative Strength Index across the daily timeframe has descended below 40, which technical analysts interpret as a bearish confirmation.
The Federal Reserve’s monetary policy positioning contributes additional downward force. Market analysts have eliminated expectations for rate reductions throughout 2026. One month prior, approximately 47% of analysts had anticipated a June reduction.
Technical Indicators Signal Further Weakness
Examining the 4-hour timeframe, three successive bearish signals have materialized since March 18. The latest signal emerged following the conclusion of U.S. market hours on April 2.
These technical patterns suggest institutional participation in the distribution process. The 4-hour RSI has entered oversold conditions, potentially creating conditions for a temporary relief rally.
Any potential bounce might provide short-position traders with improved entry opportunities ahead of a possible continuation toward $520.
Market commentator Crypto Patel noted on X that BNB had declined beneath $570 for the initial time in more than twelve months. Patel highlighted the $400–$500 range as a significant accumulation area based on Fibonacci retracement levels at 0.5 and 0.618, referencing historical price behavior.
Binance Coin currently competes closely with XRP and USDC for fifth position by total cryptocurrency market capitalization, trailing XRP by merely $1 billion.
The Fear & Greed Index registers at 9, indicating extreme fear throughout the comprehensive cryptocurrency marketplace.

