TLDR:
- BNB price trades at $855 after a 30% climb in three months, with resistance at $869 deciding the next breakout level.
- RSI shows hidden bullish divergence, suggesting underlying strength despite recent market pullbacks in crypto trading.
- Short-term holders show weaker profits, easing selling pressure and strengthening the outlook for a potential rally higher.
- Moving averages confirm a bullish setup as 7-day sits above 25-day and 99-day, pointing toward sustained crypto market strength.
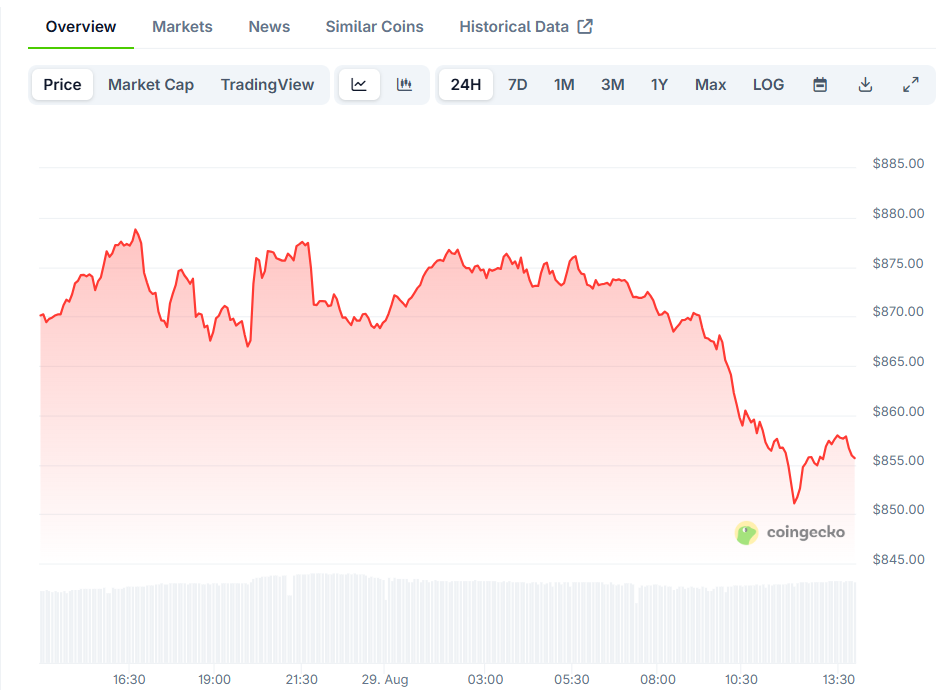
BNB has climbed steadily over the past three months, gaining around 30% even as the broader crypto market pulled back. The token recently touched $899 before easing near $865, where it now trades in a tight range.
Traders are watching resistance at $869 closely as the next turning point. A breakout could shift momentum toward the highly anticipated $1,000 mark. Analysts say the setup remains favorable for buyers despite short-term corrections.
BNB Price Holding Strong Near Key Levels
Data from CoinGecko shows BNB trading at $855.86 with a daily volume of $1.65 billion. The token has slipped 1.6% in the last 24 hours but is still up 0.74% over the past week.

Over the last quarter, prices have rebounded from June lows near $601 to current levels, reflecting steady recovery.
Wise Crypto, who shared his analysis on X, pointed out that BNB’s short-term holders are showing thinner profits. That reduces immediate selling pressure and supports stability near resistance.
His chart also highlighted a hidden bullish divergence in the Relative Strength Index, suggesting underlying demand despite recent dips.
Price action now shows consolidation just under $869. That zone has acted as a barrier in recent days, but continued buying could trigger a breakout. If momentum carries past it, traders believe the $1,000 target may quickly come into play.
🔥 $BNB price rally to $1,000 back in play?
Despite market pullbacks, $BNB hit $899—up 30% in 3 months. Now trading near $865, signals point to strength:
📉 Short-term holders show lower profits = less sell pressure
📈 Hidden bullish divergence on RSI
🚧 Resistance at $869 key… pic.twitter.com/GqdnAs4QqO— Wise Crypto (@WiseCrypto_) August 29, 2025
Technical Indicators Point to Bullish Continuation
Moving averages back the bullish setup. The 7-day average currently sits at $865.80, above the 25-day at $836.05 and the longer 99-day at $726.09. This alignment often signals positive sentiment, with shorter averages holding stronger positions above longer ones.
Volume data shows 23,979 BNB traded in the past 24 hours, confirming steady participation as prices consolidate. This activity has accompanied each push higher over the last few weeks.
Analysts say strong trading volumes can help validate breakouts when resistance levels are challenged.
Since early summer, BNB’s climb from $601 has marked one of the stronger recoveries among top tokens. The coin has consistently held above key averages through pullbacks, reinforcing the case for continued strength.
Traders now look to the $869 test as the immediate hurdle before larger gains can unfold.
If that resistance level breaks, market watchers expect a surge toward $1,000. For now, the price structure, momentum signals, and trading behavior align with a continuation of the uptrend.


