
 Price: Correction to $0.80 Following 15.7% ETF-Driven Rally")
TLDR
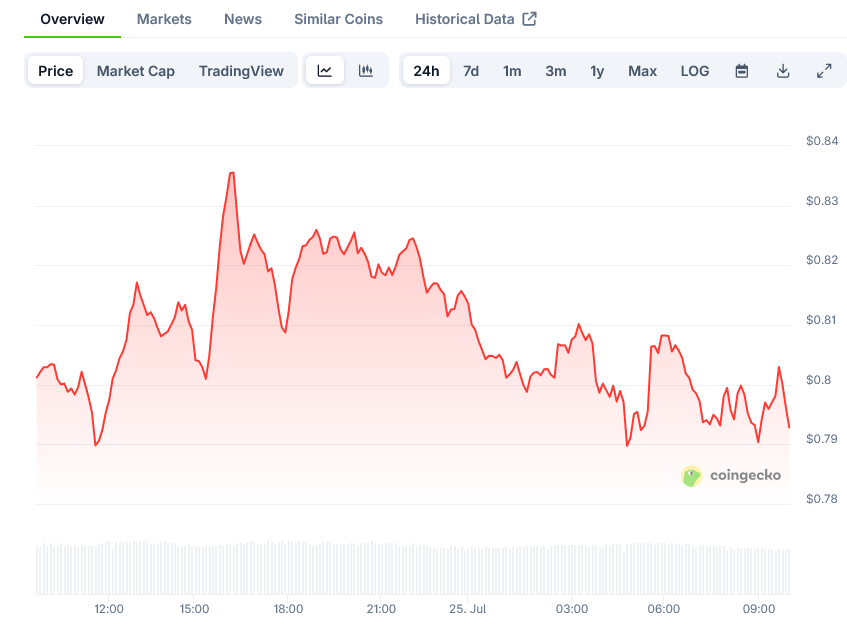
- ADA trades at $0.80, down 2.77% in 24 hours after recent ETF speculation
- Grayscale’s spot ADA ETF application drove a 15.7% surge earlier this week
- Technical indicators show RSI at 60.13 with bullish MACD divergence
- Key support sits at $0.74 with resistance at $0.94
- Trading volume remains elevated at $242.2 million on Binance
Cardano’s price has retreated to $0.80 following a sharp rally triggered by Grayscale’s spot ADA exchange-traded fund application. The cryptocurrency fell 2.77% in the past 24 hours as traders took profits from the recent surge.
The pullback comes after ADA jumped 15.7% on July 22 when news broke of Grayscale’s ETF filing. The token briefly touched $0.85 before sellers stepped in to lock in gains.
Despite today’s decline, Cardano maintains its bullish momentum from a 37% rally throughout July. The cryptocurrency has broken above multiple resistance levels that contained price action for months.
Trading volume on Binance spot markets stands at $242.2 million. This elevated activity shows continued interest from both institutional and retail traders following the ETF catalyst.
Technical Structure Remains Bullish
The relative strength index for ADA sits at 60.13, indicating neutral territory. This reading suggests the token has room to move higher without becoming overbought.
MACD indicators flash bullish signals with the main line at 0.0570 above the signal line at 0.0542. The positive histogram reading of 0.0028 confirms buying pressure remains intact.
All major exponential moving averages have flipped bullish for the first time in months. The 12-period EMA matches the current price at $0.80 while the 26-period EMA provides support at $0.74.
Cardano trades above its 20-day simple moving average of $0.75. The 50-day SMA sits further below at $0.66, providing additional support layers.
Bollinger Bands show ADA positioned at 0.6323 between the bands. The upper band at $0.94 represents the next major resistance target for bulls to overcome.
Critical Price Levels Define Trading Range
The immediate support level sits at $0.74, aligning with the 26-period EMA. This level served as resistance during the July breakout and now acts as support.
A stronger support zone exists at $0.57, marking the breakout point from earlier this month. This area would likely attract significant buying interest on any deeper pullback.
Primary resistance stands at $0.94, coinciding with the Bollinger Band upper boundary. Cardano faced rejection near $0.88 earlier this week, making $0.94 a key hurdle.
The current pivot point at $0.80 serves as a battleground between buyers and sellers. Maintaining above this level keeps the bullish bias intact from the ETF-driven rally.
Breaking above $0.94 would open the path toward the psychological $1.00 level. Many analysts view this as the next major target following the ETF news catalyst.
Daily Average True Range data shows $0.06 volatility for ADA. This indicates traders should expect 7-8% intraday price swings in either direction.
For aggressive traders, the current $0.80 price offers a risk-reward setup with stops below $0.74. This limits downside to 7.5% while targeting 17.5% upside to $0.94.
Conservative investors might wait for a pullback toward $0.74-$0.75. This range coincides with moving average support and provides better entry prices.
The 4-hour chart shows moving averages approaching a bearish crossover. Recovery attempts will likely face selling pressure at the 20-period SMA on shorter timeframes.
Bulls defended the $0.75 support level on Thursday as shown by long candlestick wicks. This buying interest prevented a deeper correction toward the 50-day SMA at $0.66.

