
 Price: Testing Critical $0.90 Support Level as Trading Volume Surges")
TLDR
- ADA price dropped 3.5%, reaching a critical support level at $0.90-$0.91
- Futures trading volume hit a five-month high of $6.96 billion
- Technical analysis shows a symmetrical triangle pattern with potential $1.10 target
- South Korea has emerged as a major driver of ADA trading activity
- TD Sequential indicator is flashing a buy signal on hourly charts
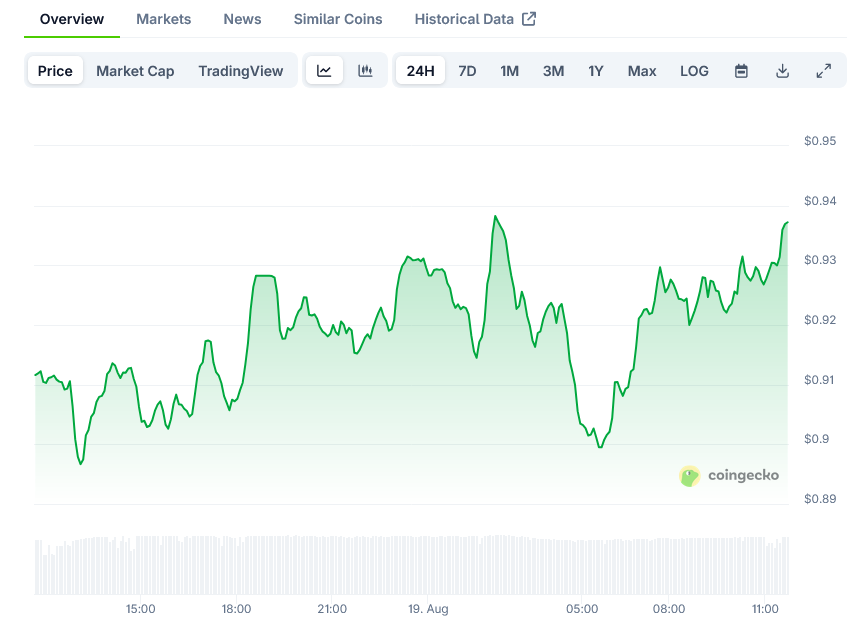
Cardano (ADA) has reached a pivotal moment in its price action, hovering at a critical support level after four days of sideways movement. The cryptocurrency experienced a 3.5% price dip on August 18, 2025, pushing it to the lower boundary of its consolidation zone at $0.91.
Despite this decline, market interest in Cardano has surged. Trading volume increased by 12% compared to the previous day, indicating growing participation from investors and traders.
On-chain data reveals that ADA’s futures trading volume reached a five-month high of $6.96 billion. This substantial increase reflects strong interest from both retail traders and institutions, potentially setting the stage for significant price movement.
The asset has been trading within a tight range between $0.90 and $0.96 for the past four days. Historically, when ADA touches the lower boundary of this range, it tends to bounce upward – a pattern that could repeat in the coming days.
Technical analysis shows Cardano consolidating within a symmetrical triangle pattern. This formation typically resolves in the direction of the prior trend, which in this case leans bullish.
Key Support and Resistance Levels
If ADA closes a daily candle below the critical $0.90 support level, it could trigger a 6.65% decline, potentially dropping to $0.835.
Conversely, if the price holds this support, it might test the upper boundary at $0.969 again. A breakout above this resistance could spark a more substantial rally, with some analysts projecting a 28% price increase.
The $1.00 mark represents a psychological resistance level that has capped multiple recovery attempts. A decisive break above this threshold could open the door to further gains, with measured move targets in the $1.08 to $1.10 region.
On-chain data from Coinglass shows that over the past 24 hours, $25.94 million worth of ADA has moved out of exchanges. This outflow suggests potential accumulation by long-term holders, which could help ease downside pressure and restore buying momentum.
Market Sentiment and Technical Indicators
The TD Sequential technical indicator is now flashing a buy signal on hourly charts, hinting at a potential price bounce. Confirmation would require bulls to reclaim the $0.92 to $0.94 resistance band.
The Supertrend indicator remains green and hovers above the price, suggesting that Cardano maintains its overall uptrend despite recent consolidation.
Traders appear to be positioning themselves for a potential move, with major liquidation levels at $0.876 on the downside and $0.928 on the upside, where traders are currently over-leveraged.
Market analysts note that Cardano’s current setup is forming higher lows, which typically builds a foundation for trend continuation. The $0.88 to $0.85 zone has repeatedly acted as a demand area, and successfully defending these levels could create a strong technical base for the next advance.
An interesting development in Cardano’s market dynamics is the emergence of South Korea as a major trading hub. The ADA/KRW trading pair has overtaken Coinbase’s ADA/USD market by nearly 2x in volume, making it the third largest globally. This surge in regional activity could serve as a catalyst for sharper price movements in the near term.
The recent consolidation period is viewed by some analysts as “healthy,” allowing ADA to absorb prior gains while maintaining structural support. Historically, similar formations in Cardano have preceded sustained rallies.
With futures activity heating up and technical signals pointing to renewed momentum, market participants are closely watching whether ADA can clear the crucial $1 neckline that has capped multiple rallies in recent months.
Cardano’s price action in the coming days will likely be determined by its ability to defend the $0.90 support or break through the $1.00 resistance.

