Eyes $1.90 as Weekly Breakout Fuels Bullish Wave")
TLDR:
- CRV broke out of a falling wedge after 917 days, triggering bullish sentiment on weekly charts.
- Price is holding above $1.05, with momentum indicators signaling strong upside potential.
- Traders are watching $1.20 as a trigger zone that could unlock a rally toward $1.90 and $3.00.
- Weekly moving averages and rising volume confirm a potential macro trend reversal in progress.
Curve DAO (CRV) has pushed into bullish territory, shaking off a 917-day downtrend. A breakout on the weekly chart has caught attention across the crypto trading community.
Traders are watching closely as price tests higher resistance levels and major technical indicators begin to align. From lower time frames to weekly candles, CRV appears to be building momentum for a sustained move.
With bullish signals stacking up, the market is gauging how far this rally might go.
CRV Lower Time Frames Signal Momentum
On the 4-hour chart, price action is heating up. The Mental Trader flagged the breakout attempt above $1.05 as a key test. As of the latest close, CRV is holding firm above that mark, setting up for potential continuation.
Momentum indicators are showing strength. RSI bounced off the bearish control zone and is now acting as a support level. The MACD crossed upward from the zero line, hinting at a fresh upward wave building.
$CRV
4H chart leading the way?15 mins for the 4H close, and it's looking good, closing above $1.05 high would be ideal for more continuation, despite the weekly level i have mentioned on my previous tweet.
full rest on the RSI back to the edge of the bearish control zone and… pic.twitter.com/pjFjYgYWCH
— The Mental Trader (@Real_Crypto_Mil) July 25, 2025
According to the same trader, CRV is now trading above all major exponential moving averages on timeframes up to the daily. The next goal lies in reclaiming the 200-week EMA. If that level flips into support, it could clear the path toward higher targets.
This setup builds on strong market structure. The Mental Trader noted that lower timeframe bullishness often leads the trend for higher timeframes. In CRV’s case, daily and weekly alignment may be shaping up.
Weekly CRV Chart Chart Shows Breakout Confirmation
CryptoBullet’s update adds a broader lens to the outlook. CRV recently broke out from a falling wedge that held for nearly 2.5 years. This breakout followed long-term accumulation from mid-2022 through 2024.
$CRV 1W (linear chart) update
🎯 Targets remain pic.twitter.com/r3hljR9OxE
— CryptoBullet (@CryptoBullet1) July 25, 2025
Support has held through multiple retests, with price forming clear higher lows. The weekly 55 MA is now flattening and turning upward, reinforcing the bullish trend.
Targets remain clear. The first major resistance sits at $1.90, a key psychological and technical level. A move through it could open space toward $3.00.
Volume spikes around the breakout confirm strong participation. Traders are closely watching the $1.20 mark. A push above this could accelerate momentum and shift sentiment further toward the bulls.
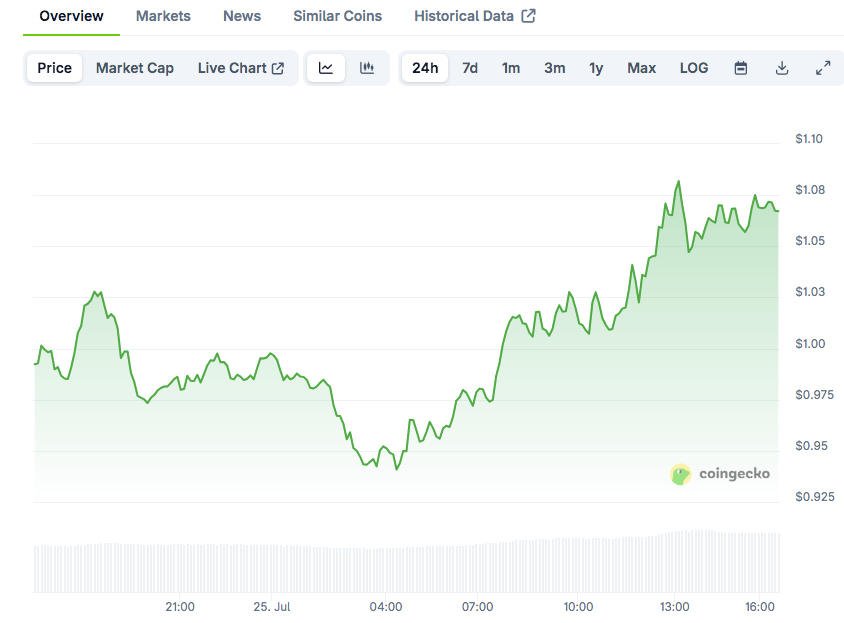
CRV trades at $1.07, according to CoinGecko, up 7.81% in 24 hours. Weekly gains now stand at nearly 6%, with rising volume and steady structure suggesting the move may not be over yet.