
 Price Breaks $0.10 Barrier as Network Activity Explodes 176%")
Key Highlights
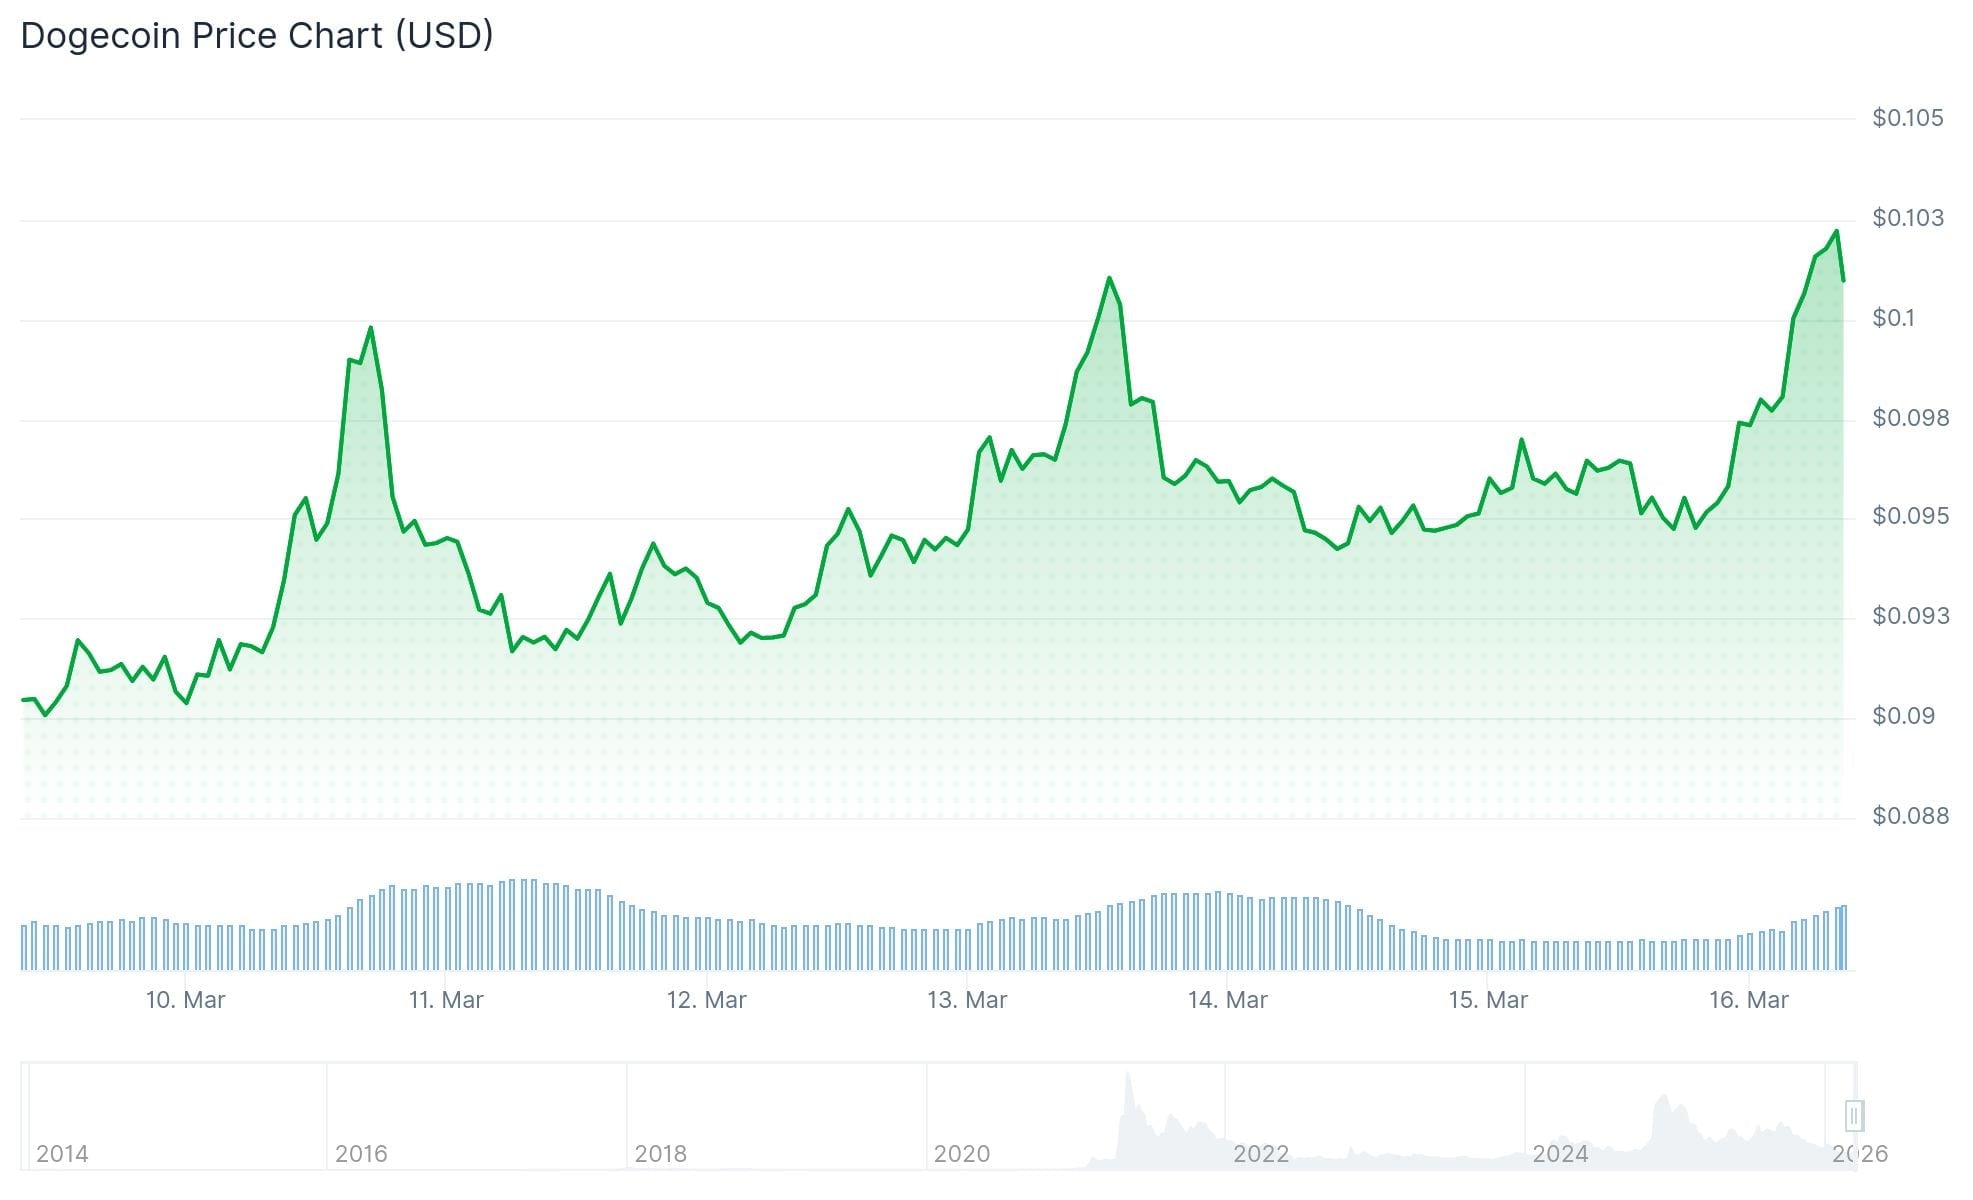
- Dogecoin surged past the $0.10 threshold, peaking at $0.1013 before entering consolidation
- Network engagement skyrocketed 176% weekly, with active addresses jumping from 41,557 to 114,662
- Critical overhead resistance positioned at $0.1020, followed by targets at $0.1050 and $0.1080
- Daily timeframe shows RSI at 57 with bullish MACD crossover confirmation
- Rejection at $0.1020 resistance could trigger pullback to $0.0955 support zone
Dogecoin has demonstrated impressive strength throughout the current trading week, successfully reclaiming the psychologically important $0.10 level amid broader cryptocurrency market recovery. The meme coin touched an intraday peak of $0.1013 before entering a brief consolidation phase.
Currently, DOGE maintains trading activity above the $0.0985 level and continues holding above its 100-hourly simple moving average. Chart analysis reveals an ascending trend line providing structural support near the $0.0955 region.
The primary barrier traders are monitoring sits at $0.1020. Successfully breaching this level could unlock a path toward $0.1050, with subsequent extension potential to $0.1080.
Should Dogecoin establish a daily close above $0.1080, market participants would likely shift focus toward $0.1120 as the intermediate target, with $0.1220 representing an extended objective.
Momentum Indicators Signal Bullish Setup
Examining the daily timeframe, the Relative Strength Index currently registers at 57, positioned above the midpoint threshold of 50 while displaying upward trajectory. This configuration suggests accumulating positive momentum.
Meanwhile, the Moving Average Convergence Divergence indicator has generated a bullish crossover signal, reinforced by expanding green histogram bars that validate the ongoing price appreciation.
Dogecoin is now testing its 50-day Exponential Moving Average situated at $0.102. Securing a daily candle close above this technical marker would represent a constructive development, positioning $0.110 as the subsequent zone of interest.
The weekly timeframe presents resistance at $0.119, which coincides with the 100-day EMA, establishing this confluence area as pivotal should the uptrend maintain its trajectory.
On-Chain Metrics Show Increased Engagement
Blockchain data reveals Dogecoin’s active address count exploded by 176% over a seven-day period, climbing from 41,557 to 114,662. This dramatic increase in network participation indicates heightened user engagement and transactional activity on the protocol.
Elevated levels of network interaction typically correlate with increased demand for token movements and utility. Market observers suggest that sustained elevated network metrics could provide fundamental support for continued buyer interest.
DOGE was changing hands at $0.096 according to CoinMarketCap data as of March 15, representing a 1.36% intraday gain and marking more than 7.5% appreciation compared to the previous week.
From a risk perspective, failure to overcome the $0.1020 resistance would likely see price action retreat to initial support at $0.0995, with secondary support established at $0.0978. The critical support threshold resides at $0.0955.
A decisive breakdown below $0.0955 would expose downside targets at $0.0940, potentially extending to $0.0920 in a more pronounced correction scenario.
Market analyst Trader Tardigrade highlighted on March 13 that DOGE had made contact with a long-term historical support trendline for the third occurrence — a technical level that has maintained integrity for over ten years.
The substantial 176% expansion in active addresses documented on March 15 stands as one of the most compelling fundamental data points underpinning the current price movement.

