TLDR
- Dogecoin currently trades at $0.21-0.22, down 22% over the past month
- Technical analysts identify a descending triangle pattern that could trigger a 40% price swing
- Key support at $0.21 held during a V-shaped recovery on August 20-21
- Whale investors accumulated over 680 million DOGE in August despite security concerns
- Long-term price targets remain bullish with some analysts projecting $0.70-$1.30
Dogecoin is currently testing key technical levels while large investors continue accumulating the popular memecoin. The cryptocurrency has been trading near the $0.21-$0.22 range after experiencing pressure throughout August 2025.
The price stood at $0.21 at earlier press time, having lost approximately 22% of its value over the past month. Despite this decline, DOGE managed to gain 1.02% in a 24-hour period, showing early signs of stabilization.
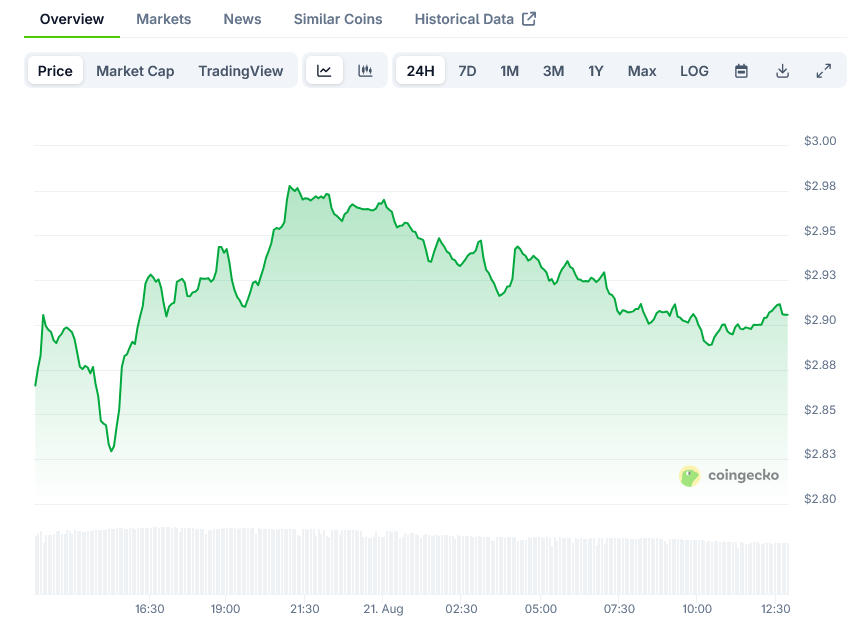
The most recent price action saw DOGE complete a V-shaped recovery on August 20-21. After touching lows of $0.21 during mid-session trading around 13:00 UTC on August 20, the price reversed course and closed at $0.22.
This reversal coincided with a substantial spike in trading volume. During the final hour of the session, volume surged to 9.29 million, confirming the presence of larger market participants.
Technical analysts have identified a compression pattern forming around Dogecoin’s price. This descending triangle formation occurs when lower highs press against horizontal support levels.

Whale Accumulation Counters Retail Selling
On-chain data reveals that whale investors accumulated over 680 million DOGE tokens throughout August. This accumulation occurred despite ongoing security concerns related to a potential Qubic 51% attack that has worried retail traders.
The sustained turnover rate of 6.8 million per minute during the final trading hour on August 20 suggests institutional-sized flows are entering the market. These larger buyers appear to be driving the recent momentum shift.
This whale positioning stands in contrast to the behavior of retail investors, many of whom have been selling their holdings due to security concerns. The divergence between these two investor groups has created an interesting dynamic in the market.
Market analyst Shan Specter noted that Dogecoin maintains a “constructive structure” despite recent pressures. He suggested the current consolidation phase might simply be a reset before further expansion in price.
Technical Indicators Point to Volatility
Several technical indicators suggest Dogecoin might be preparing for increased volatility. The current market structure has formed a descending triangle, with previous resistance near $0.24 and support near $0.22.
Trading activity has been relatively subdued within this pattern. Analysts note that declining volume during consolidation periods often precedes volatility spikes. They expect a breakout once the triangle reaches its apex.
The 12-hour chart highlights important Fibonacci retracement levels that are shaping market sentiment. The 0.5 retracement level near $0.22 has provided support, while resistance appears near the 0.618 retracement around $0.23.
Bollinger Bands and the Moving Average Convergence Divergence (MACD) indicator both show potential for increased volatility. Bollinger Bands have expanded during past swings, while MACD shifts have often signaled momentum reversals.
Traders are now watching to see if the $0.22 level can transition from resistance into support. If this occurs, it could open a path toward the $0.23-$0.24 range.
If buyers regain momentum, Dogecoin could revisit the $0.29 level. However, failure to hold current support risks a decline toward $0.19, which aligns with key Fibonacci retracement points.
On higher timeframes, analysts point to a series of higher lows since early 2025. This pattern suggests the long-term uptrend remains intact despite recent pressure.
Some analysts maintain ambitious long-term targets for Dogecoin. Specter projected a potential cycle target between $0.70 and $1.30, citing consistent support from entrepreneur Elon Musk as a factor sustaining long-term investor interest.
The weekly chart reinforces this perspective. While the MACD shows momentum flattening, higher lows keep the structure intact. Bollinger Bands suggest volatility could return later in the year.
At press time, Dogecoin trades at $0.22 after completing its V-shaped recovery. The direction of the upcoming breakout from the descending triangle will likely determine the token’s path in the months ahead.


