
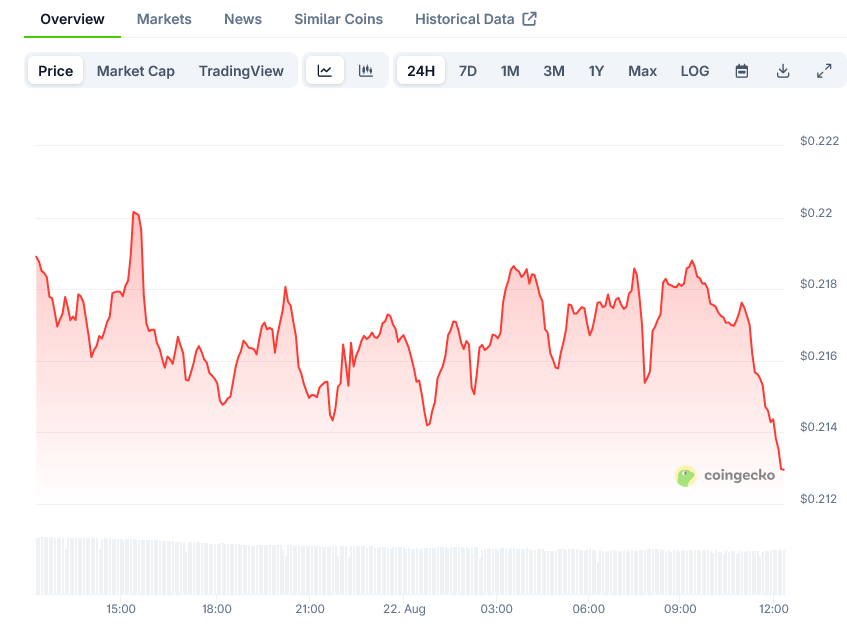
 Price: Trading at $0.21 with Support Between $0.19-$0.20")
TLDR
- Dogecoin trading around $0.21, showing triangle and cup-and-handle patterns that historically precede rallies
- Key resistance level at $0.29, with support between $0.19-$0.20
- RSI improving from oversold territory, suggesting momentum shift
- Multiple analysts tracking breakout signals with potential targets up to $0.80 by late 2025
- Short-term setup offers favorable 6.5 risk-to-reward ratio according to analysts
Dogecoin is currently trading at approximately $0.21, having gained about 2.3% in the past 24 hours despite seeing declines of 4.4% over the past week and 17% over the past month. Technical analysts have identified several chart patterns that suggest DOGE might be preparing for a significant move in the coming months.
The meme-inspired cryptocurrency has formed multiple bullish patterns on recent charts. Analyst Zeinab pointed out that DOGE is displaying a rounding bottom formation, which typically develops before a new uptrend begins.
The token is also moving within a converging triangle pattern. This triangle formation often signals decreasing volatility before a breakout occurs in either direction.
According to Zeinab’s analysis, the major resistance level for Dogecoin sits near $0.29. A clear move above this threshold could mirror an earlier climb when DOGE advanced from around $0.18 to $0.49.
If this momentum extends further, she suggests DOGE could potentially target levels near $0.80 by the final quarter of 2025.
Traders are watching the $0.29 level with particular interest, as this zone acts as the primary ceiling for the current trend. Until the token breaks above that point, the bullish setup remains unconfirmed.
Volume trends appear to support this view, with data showing steady buying interest in recent weeks. However, liquidity remains below levels recorded during previous rallies. Analysts suggest that a sharp increase in trading activity could help validate the bullish scenario.
Short-Term Trading Opportunities
For shorter-term traders, analyst Cryptoinsightuk has identified a separate opportunity. He notes that DOGE has swept both recent highs and lows, clearing stop orders on both sides of the market. This action often precedes a reversal.
He calculates a risk-to-reward ratio of 6.5 for this setup. A ratio above 1 suggests the potential return outweighs the risk, and ratios above 5 are generally considered attractive for traders.
The Relative Strength Index (RSI), which measures momentum on a scale from 0 to 100, has turned upward after reaching oversold territory. At the time of writing, the RSI is approaching the midpoint, which signals improving momentum.
Cryptoinsightuk maintains a low-leverage swing position in DOGE and argues that the technical setup is particularly relevant for traders seeking shorter-term entries.
A lot of crypto setting up similarly here.
Take $DOGE for example.
Highs swept.
Lows swept.
Now decent 4HR volume and potential to see RSI cross bullish from near oversold levels.
This offers a nice 6.5 R/R ST trade set up.
NB I am not taking this trade, I'm already in a… https://t.co/rlYFrVopqJ pic.twitter.com/eByVjZIKo6
— Cryptoinsightuk (@Cryptoinsightuk) August 20, 2025
Volume analysis supports this thesis as well. The combination of rising RSI and steady turnover increases the odds of another test of the $0.29 level.
If the token fails to clear that zone, downside risk remains toward the $0.20 support band.
Technical Outlook
At press time, Dogecoin‘s market capitalization stands at about $33 billion, with trading volume close to $3.4 billion. The all-time high remains at $0.7375.
Analyst Andrew Griffiths has observed that the token has shaped a cup-and-handle formation, another bullish chart pattern that appears as a rounded base followed by a smaller pullback.
Griffiths states that a confirmed move above $0.30 could push DOGE toward the upper channel boundary. He identifies support between $0.19 and $0.20 as the critical floor.
If the token holds this area, his model points to resistance near $0.38 as the next target.
Some analysts point to bearish indicators as well. The Bollinger Bands are widening, suggesting expanding volatility. The upper band is at $0.2499, while the lower band at $0.1924 could become a downside target if current support fails.
The 9-day DEMA sits at $0.2197, with the price trading below it. A move above this level would be an early strength signal, while rejection would maintain downward pressure.
The MACD line at -0.00203 is below the signal line, confirming a bearish cross. The histogram bars are turning red, indicating building momentum against buyers.
The alignment of multiple technical signals—rounding bottom, triangle, and cup-and-handle—has led analysts to track DOGE closely. They suggest that momentum indicators and volume will determine whether the token can advance toward higher levels in the final quarter of 2025.

