

TLDR:
- Ethereum’s derivatives market saw Bybit record a rise of around 2.51 million ETH, pointing to active liquidity redistribution across platforms.
- Ethereum’s SuperTrend indicator flipped from Sell to Buy for the first time since September, previously triggering gains of 52% and 174%.
- ETFs accumulated roughly 83,000 ETH worth approximately $193 million over three weeks, adding real institutional demand pressure.
- Ethereum reclaimed $2,200 as support after 39 days below it, with traders now watching $2,400 and $2,600 as the next key levels.
Ethereum is drawing renewed attention as derivatives market data points to a structural shift in trader behavior. Open interest figures across major exchanges show clear signs of liquidity redistribution rather than outright capital outflows.
Technical indicators are flipping bullish for the first time in months. ETF demand over recent weeks adds another layer of confidence to the trend currently taking shape.
Open Interest Data Points to Liquidity Redistribution
Ethereum’s derivatives market is showing a notable divergence across trading platforms. The ETH Open Interest 30D Change indicator reveals clear shifts in the structure of open positions.
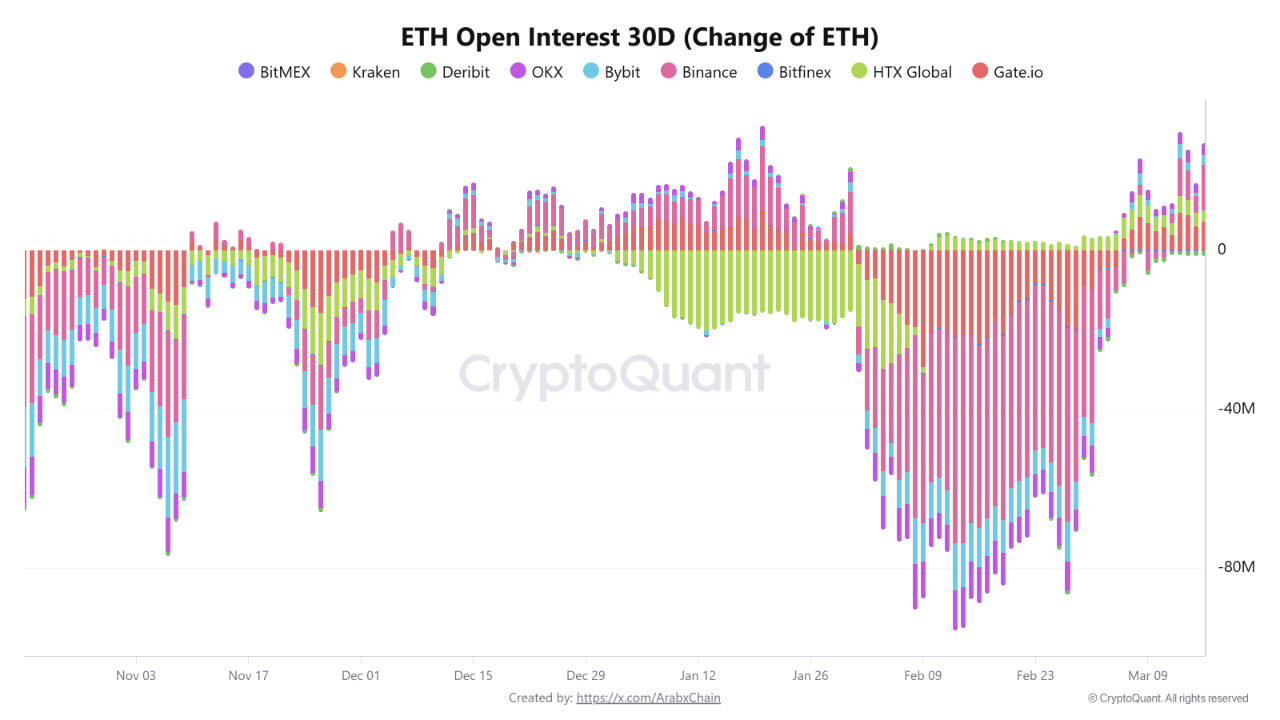
Source: Cryptoquant
Binance recorded an increase of approximately 11,400 ETH, indicating continued liquidity inflows. This points to ongoing activity despite recent market fluctuations.
Bybit also posted a notable rise of around 2.51 million ETH. This further supports the idea of redistribution rather than a wholesale exit from positions.
Bitfinex, however, saw a decrease of roughly 35,700 ETH, while Kraken dropped by around 4,300 ETH. Gate.io also recorded limited movement compared to other major platforms.
These figures reflect weaker activity or reduced risk appetite on certain exchanges. Still, the contrast between platforms does not point to a market breakdown.
Rather, it suggests a state of caution and repositioning ahead of stronger moves. Traders closing positions on some platforms are opening new ones elsewhere.
Sustained liquidity inflows into the derivatives market support the stability of Ethereum’s uptrend. Elevated or rising open interest signals trader confidence and a willingness to hold positions.
This pattern reinforces the persistence of bullish momentum rather than pointing to a temporary move. The data overall leans toward continued upward pressure on price.
Technical Indicators and ETF Demand Reinforce the Uptrend
Ethereum recently triggered a key technical signal that traders have been watching closely. Analyst Ali Charts noted that the SuperTrend indicator flipped from Sell to Buy for the first time since September.
In the previous two instances, price surged by 52% and 174% respectively. This kind of reversal signal tends to attract both technical and momentum-driven traders.
A critical part of the breakout involves reclaiming a key price level. Ethereum managed to hold above $2,200 after spending 39 days trading below it. This reclaim marks a clear structural shift in price action. The next levels to watch are $2,400 and $2,600.
ETF demand has also played a measurable role in reinforcing the current move. Over the past three weeks, ETFs accumulated approximately 83,000 ETH, worth around $193 million.
This level of institutional buying adds real demand pressure to the market. It also reduces the likelihood of a sharp reversal in the near term.
As Ethereum continues building on these technical and structural developments, traders are watching for follow-through.
The combination of rising open interest, a trend reversal signal, and ETF-driven demand creates a layered bullish case.
Whether price can sustain gains above current levels will be key. The coming weeks will test the strength of this recovery.

