
 Climbs Above $2,000 as Bullish Momentum Returns")
Key Highlights
- ETH maintains position above the crucial $2,000 threshold with derivatives metrics indicating growing buyer strength.
- Taker volume data has shown positive readings consistently since early March, reflecting dominant buyer activity.
- Open interest in Ethereum futures climbed to 6.4 million ETH, approaching 2024’s highest levels.
- U.S. spot Ether ETFs attracted $120 million in net capital, marking the strongest single-day performance since mid-March.
- Market watchers emphasize the importance of maintaining $2,000, with additional support identified between $1,750 and $1,800.
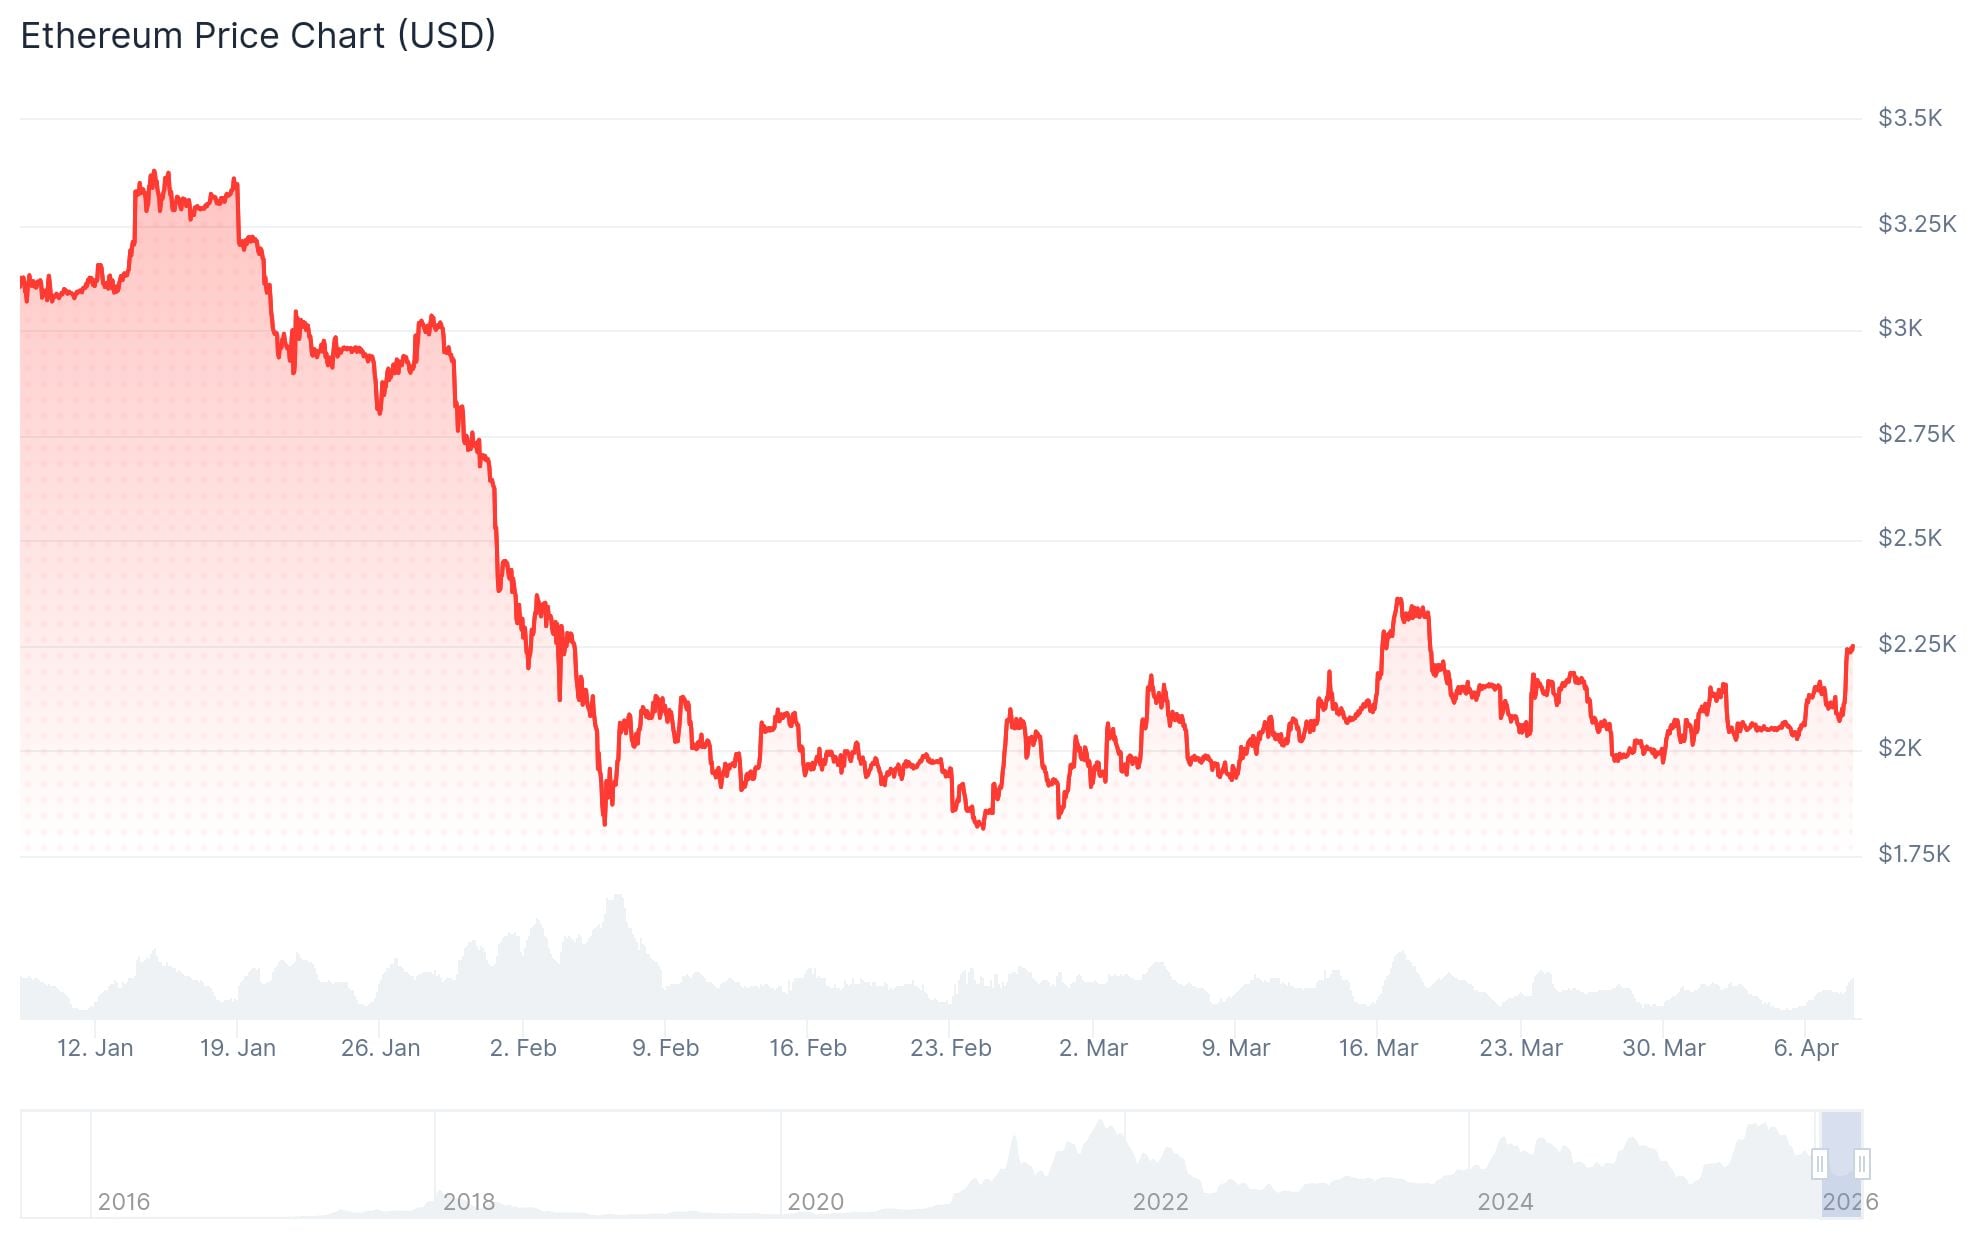
Ethereum (ETH) is currently changing hands near $2,249 following a successful defense of the $2,000 support region by market participants. Emerging data indicates a notable uptick in buying interest.
Market observers monitoring futures markets report that purchasing activity has overtaken selling pressure. This transition has sparked discussion about a potential trend reversal.
Taker volume has registered positive values continuously since the beginning of March. This indicator measures whether aggressive purchasers or sellers dominate derivatives markets.
According to analyst Darkfost, buy-side pressure continues with taker volume reaching $104 million. He highlighted that such a sustained shift in Ethereum’s derivatives market hasn’t been observed since the previous bear cycle.
Futures Markets and ETF Activity Point to Renewed Interest
The analyst further noted that this configuration could fuel an upward trajectory if sustained alongside improving spot market conditions. Growing futures participation reinforces this outlook.
Open interest in Ethereum futures has expanded to 6.4 million ETH. This figure nears the record high of 7.8 million ETH recorded in July of last year.
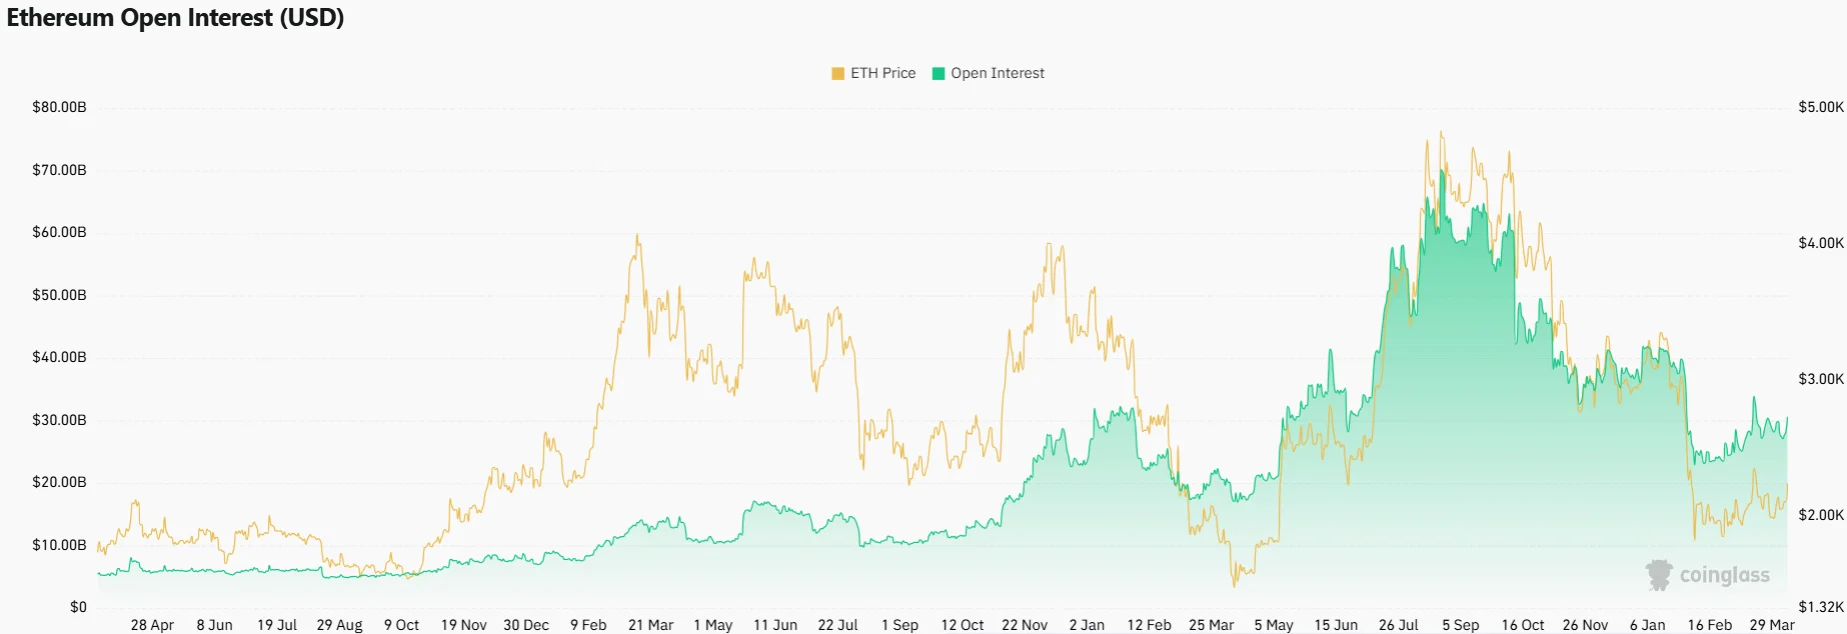
After declining to 5 million ETH in October, open interest has staged a comeback. This recovery demonstrates continued engagement in derivatives trading.
Exchange-traded funds tracking Ether’s spot price also exhibited renewed appetite. These investment vehicles saw $120 million in net additions on Monday, representing the strongest daily performance since the middle of March.
This influx reversed a brief period of withdrawals. The capital movement indicates renewed accumulation by institutional investors in the United States.
The cryptocurrency briefly pushed above $2,250 before encountering resistance. Technical charts on the hourly timeframe showed a breakout above triangle pattern resistance around $2,150, though the advance subsequently moderated.
The Significance of $2,000 Support
Technical analysts maintain that Ethereum’s chart pattern remains favorable provided the $1,800 to $2,000 support region remains intact. This zone aligns with both the 20-day exponential moving average and the lower boundary of a symmetrical triangle formation.
Analyst Ted Pillows suggested Ethereum could extend gains if the $2,000 level proves resilient. Conversely, a breakdown below this threshold might trigger a decline toward fresh yearly lows.
On-chain cost basis analysis reinforces the importance of the $2,000 region. Data shows more than 3.5 million ETH tokens were accumulated around this price point.
An additional concentration of buying interest exists between $1,750 and $1,800, representing 1.36 million ETH in acquired tokens. Should this zone fail, the triangle pattern projects a potential target near $1,460.
Ali Charts noted in a recent post that Ethereum’s 0.80 MVRV indicator band is positioned around $1,880. Historical patterns suggest this level often marks seller exhaustion and attracts long-term accumulation.
For near-term price action, critical support levels include $2,220, $2,165, and $2,120. Overhead resistance is concentrated near $2,250 and $2,275, with the current price action maintaining stability above $2,200.

