
 Price: $4,500 Resistance Level Remains Key Barrier for Bulls")
TLDR
- Ether dropped to $3,500 Thursday but onchain data shows no signs of deeper decline
- ETH/BTC exchange inflows ratio indicates lower selling pressure for Ethereum versus Bitcoin
- Major support levels sit between $2,000-$3,000 with resistance at $4,500
- Spot Ethereum ETFs recorded $332.2 million inflows Wednesday, their seventh-best day ever
- ETH bulls need to push price above $3,860 to target $4,000
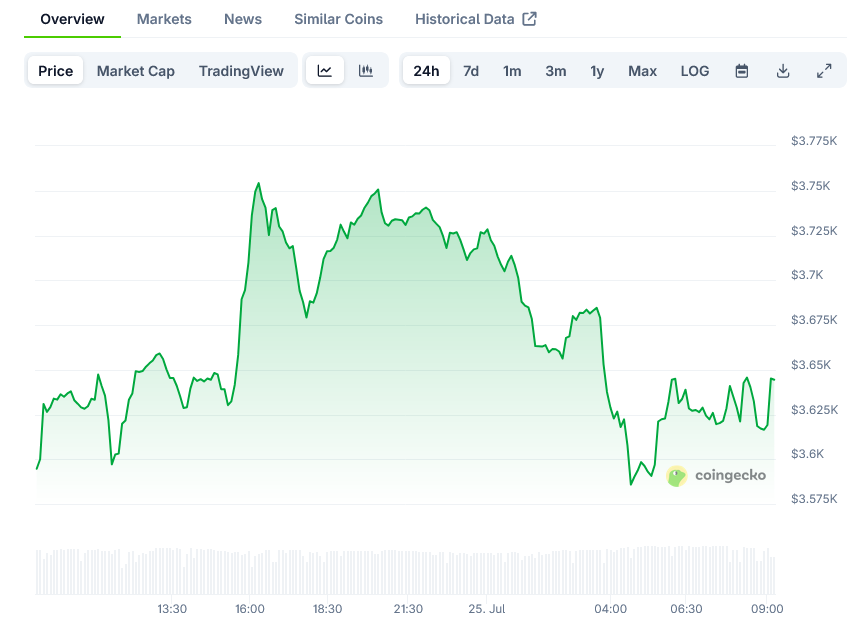
Ether price has reclaimed the $3,600 level after a brief drop to $3,500 during early Asian trading hours on Thursday. Market analysts maintain that Ethereum’s uptrend remains intact despite the 9% pullback from recent seven-month highs.
The recovery comes as onchain data provider CryptoQuant reports that Ethereum faces “lower selling pressure” compared to Bitcoin. This assessment is based on the ETH/BTC exchange inflows ratio, which dropped to five-year lows in May and continues to remain well below extreme levels.
“Lower ETH/BTC exchange inflow ratio indicates lower selling pressure for ETH,” CryptoQuant noted in its latest Weekly Crypto Report. The firm views this as a bullish signal for ETH relative to Bitcoin.
The ratio shows that less ETH is being sent to exchanges compared to Bitcoin. This metric supports the potential for further gains in the ETH/BTC trading pair.
ETF Demand Strengthens
The ETH/BTC ETF Holding Ratio has increased to 0.12 from 0.02 in May. This indicates investors are gaining more exposure to ETH than Bitcoin through exchange-traded funds.
Spot Ethereum ETFs demonstrated their strength by recording $332.2 million in inflows on Wednesday. This marked their seventh-best day of inflows since launching.
The performance contrasts sharply with spot Bitcoin ETFs, which experienced a three-day streak of outflows totaling $285.2 million. Ethereum ETFs have accumulated nearly $8.7 million in net inflows and now manage over $16.6 billion in assets.
The growing ETF demand points to “increasing demand for ETH at the margin,” according to CryptoQuant. This trend adds support to Ethereum’s price outperformance relative to Bitcoin.
Key Price Levels Identified
Glassnode analysts have outlined critical support and resistance levels using Ethereum’s cost basis model. The model incorporates average purchase prices including the true market mean and active realized price.
Major support exists between $2,000 and $3,000. The realized price sits at $2,100, the true market mean at $2,500, and the active realized price at $3,000.
“This price range would serve as an important level of support in the event that the price corrects back toward it,” Glassnode stated.
The primary resistance level stands at $4,500. This represents Ethereum’s active realized price pushed one standard deviation higher.
This price band has historically acted as resistance, including during March 2024 and the 2020-21 cycle. Glassnode notes that breakouts above this level tend to coincide with heightened market euphoria.
“$4,500 can be identified as a critical level to watch on the upside, especially if Ethereum’s uptrend continues and speculative froth builds further,” the analytics firm explained.
For the immediate term, ETH bulls must push the price above $3,860 to open the path toward $4,000. This level represents the next hurdle before attempting to challenge the major $4,500 resistance zone.

