
 Price: Multiple Resistance Levels Emerge Between $4,220 and $4,370")
TLDR
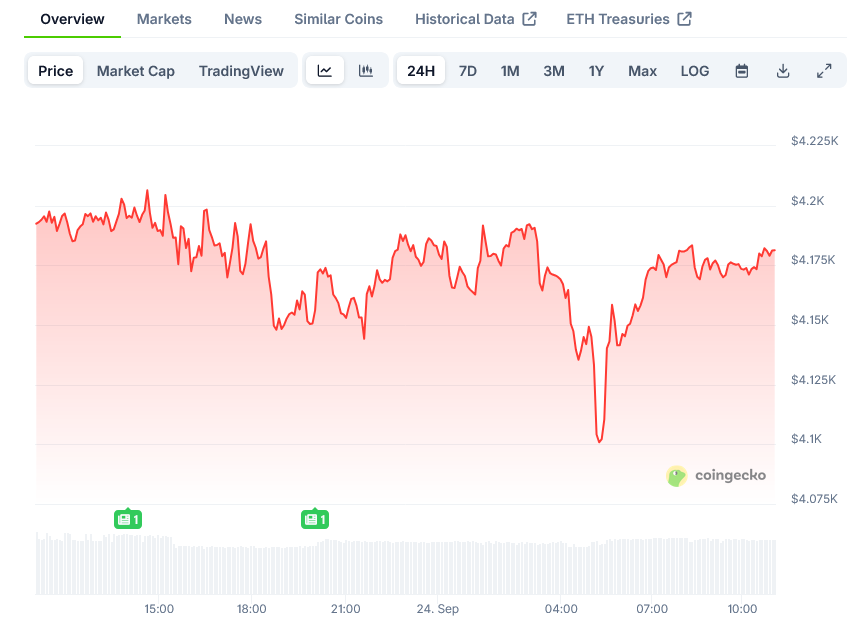
- Ethereum failed to sustain momentum above $4,500 and declined below $4,200
- ETH is currently trading below the 100-hourly Simple Moving Average
- Analysts predict potential further decline to $3,550-$3,750 range
- Alternatively, a breakout scenario could lead to $8,400 if technical setup succeeds
- Major resistance levels identified at $4,280, $4,320, and $4,370
Ethereum, the second-largest cryptocurrency by market capitalization, is showing mixed signals as it struggles to maintain momentum above key price points. Recent price action indicates a potential consolidation phase with technical indicators suggesting possibilities for both bearish and bullish scenarios in the coming weeks.
Ethereum recently faced rejection at higher levels after failing to extend gains above the $4,500 zone. This led to a fresh decline, pushing the price below several key support levels including $4,420, $4,350, and eventually $4,200. The cryptocurrency found temporary support near $4,000 before attempting a recovery.
The price is currently trading below the 100-hourly Simple Moving Average, which typically signals bearish sentiment in the short term. A key bearish trend line has formed with resistance near $4,370 on the hourly chart, creating an important barrier for any potential upward movement.
On the upside, Ethereum faces immediate resistance at $4,220. If the price manages to break above this level, the next major resistance would be at $4,280, followed by $4,315, which corresponds to the 50% Fibonacci retracement level of the recent downward movement from $4,636 to $4,000.
Potential Downside Scenario
If Ethereum fails to clear the $4,215 resistance level, analysts believe it could start another decline. The initial support on the downside sits near $4,125, with a stronger support level at $4,050.
Breaking below these supports could send ETH toward the $4,000 psychological level. Any further selling pressure might push the price down to $3,880, with the next major support at $3,750.
Some technical analysts, including Michaël van de Poppe, suggest a potential 15% correction in the near term. Based on the breakdown from a symmetrical triangle pattern, ETH could potentially slide toward $3,560. This projection aligns with a key support zone in the $3,550-$3,750 range.
The 20-week exponential moving average, currently positioned near $3,685, is also being closely watched as an important technical level that could provide support if the downtrend continues into October.
Bullish Outlook Remains
Despite the current bearish signals, not all analysts are pessimistic about Ethereum’s price trajectory. According to analyst Merlijn the Trader, ETH may be preparing for a sharp rebound that could potentially lead to much higher levels.
ETHEREUM JUST FLIPPED RESISTANCE INTO SUPPORT.
3 rejections in the past.
Now a clean breakout + bullish retest.The next chapter is written:$ETH is gearing for liftoff. pic.twitter.com/VlMOlbskXA
— Merlijn The Trader (@MerlijnTrader) September 23, 2025
After three failed attempts to clear resistance, Ethereum finally broke through a ceiling around $4,100 that had capped its price throughout 2024 and into mid-2025. This decisive move, coupled with a series of higher lows while pressing against the same horizontal barrier, has been interpreted as a sign of growing demand.
What makes this development more compelling is that when Ethereum retested its former resistance from above, the level held and flipped into support. Technical traders view such retests as healthy checkpoints in a larger uptrend.
If this bullish scenario plays out, chart projections point toward potential targets of $6,000 and even $8,400, aligning with a broader narrative of renewed strength in the crypto sector.
The hourly MACD for ETH/USD is currently gaining momentum in the bearish zone, while the RSI remains below the 50 level, suggesting short-term weakness. However, Ethereum is hovering near a rising trendline that has supported its uptrend since April, a level that in past cycles has preceded rallies of 90% to 125%.
Market participants are advised to watch key levels closely as compression continues to build, suggesting a significant move may be ahead in either direction. Ethereum has already fallen nearly 20% from its recent peak, which some analysts describe as a reasonable area for investors to begin building positions.
Ethereum’s price action in the coming days will likely determine which scenario – the bearish correction or the bullish breakout – will dominate the market sentiment for this leading altcoin.

