
 Price: Testing Support at $3,650 as Market Sees Ownership Shift")
TLDR
- Ethereum faces correction after peaking near $4,400, now testing support at $3,650
- Mid-sized sharks (10,000-100,000 ETH holders) are increasing accumulation while whales reduce holdings
- ETH ownership consolidation is driving up the Gini coefficient after months of decline
- Massive $1.1 billion in crypto market liquidations, with Ethereum accounting for $409 million
- Despite 20% correction from peak, analysts see potential buying opportunities at current levels
The Ethereum market is experiencing a shift in ownership dynamics as price action tests key support levels following a substantial correction from recent highs.
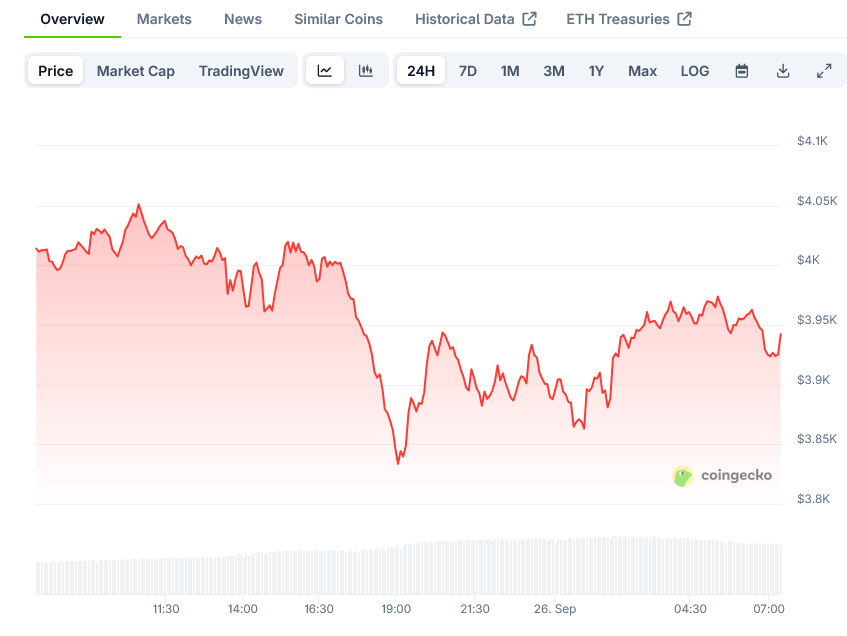
ETH is now trading close to $3,865 after dropping around 13% from recent highs above $4,400.
This correction comes after ETH tested the top Bollinger Band near $5,200, marking an overextension in price.
Despite this pullback, Ethereum remains above all key exponential moving averages, with the 20 EMA at $3,653, 50 EMA at $3,162, 100 EMA at $2,874, and 200 EMA at $2,483.
The current price structure indicates Ethereum maintains its macro long-term bullish trend.
A key observation in the market is the changing behavior of different holder categories. Joao Wedson, Founder and CEO of Alphractal, has pointed out that large whales are reducing their holdings.
Meanwhile, mid-sized sharks – holders with between 10,000 and 100,000 ETH – are becoming more active in the market.
These mid-sized entities, often funds and private investment firms, are steadily increasing their market share and now drive a major portion of ETH accumulation.
Whale Exodus And Wealth Concentration
The exit of whales has created space for these mid-sized sharks to dominate accumulation patterns.
This shift has direct consequences for Ethereum’s wealth distribution. The Gini coefficient, which measures inequality, has started rising again after months of decline.
This signals that ETH ownership is consolidating among wealthier addresses, particularly these mid-sized entities.
Many of these larger holders are likely exchange institutional funds or former miners who are consistently offloading positions.
The initial key support level for ETH price is the Bollinger Band midpoint at $3,459, which sits close to the 20 EMA.
Technical indicators suggest cooling momentum, with the MACD histogram positive but slowing down, the Chaikin Oscillator declining at 57K, and the RSI likely between 60-65.
These signals collectively suggest a period of consolidation or further correction may be needed before Ethereum can resume its upward trajectory.
Market Liquidations And Institutional Flows
The broader crypto market has experienced over $1.1 billion in liquidations, with Ethereum leading at $409 million, while Bitcoin saw $272 million in the last 24 hours.
A total of 233,337 traders were liquidated during this period. The largest single liquidation occurred on Hyperliquid, where an ETH-USD order worth $29.12 million was closed.
Institutional sentiment around ETH appears to be weakening, with spot Ether ETFs recording over $250 million in outflows. Fidelity’s FETH led with the most outflows at $158 million.
Interestingly, even the launch of the first Ether staking ETF has not significantly improved market sentiment.
For traders and investors, near-term resistance for Ethereum sits between $4,450 and $4,500, while support at $3,650 will be crucial for maintaining short-term price stability.
The number of Ethereum whales is dropping sharply – and the sharks are now in the game!
It’s the sharks (10k–100k ETH holders) who have been accumulating and taking a larger share of the market.
Meanwhile, the Gini coefficient has stopped falling and is starting to rise again,… pic.twitter.com/Lk2E6saulJ
— Joao Wedson (@joao_wedson) September 24, 2025
If this support level holds and buying pressure returns, ETH could test $4,500 and potentially make another attempt toward the $5,000-$5,200 zone.
However, breaking below $3,162 would expose the price to further declines toward $2,874 or possibly the $2,500 level.
Crypto analyst Ted Pillows has outlined that ETH is currently holding support near $3,822. A breakdown below this level could push the price toward $3,700-$3,750.
Michael van de Poppe highlighted Ethereum’s technical setup, noting a gap with the 20-day exponential moving average (EMA) and the weekly 20-EMA closing in.
Van de Poppe suggested these signals indicate the market may be nearing the bottom of its current correction, presenting a potential buying opportunity for investors.
The ETH price is now trading below the $4,000 support level, with current support at $3,650 playing a major role in preserving short-term stability.
The current market structure suggests Ethereum is in the final leg of its correction after dropping 20% from peak values.

