
 Slides to $2,100 as MVRV Metric Signals Historic Buying Opportunity")
Key Takeaways
- ETH has moved into a historically significant MVRV value zone ranging from 0.8 to 1.0, indicating potential market bottom formation
- Following rejection near $2,400 resistance, Ethereum declined sharply to test $2,100 support
- Current trading action positions ETH beneath $2,200 and its 100-hour Simple Moving Average
- Critical near-term support exists between $2,100–$2,150, while deeper support emerges around $1,770 should selling intensify
- Breaking above $2,200 could trigger upward momentum toward $2,240, $2,275, and possibly $2,385
Ethereum currently hovers near $2,100 following a significant pullback from the $2,385 region. The digital asset breached multiple support levels including $2,320 and $2,250, eventually breaking a significant uptrend line that had provided support around $2,160 on shorter timeframes.
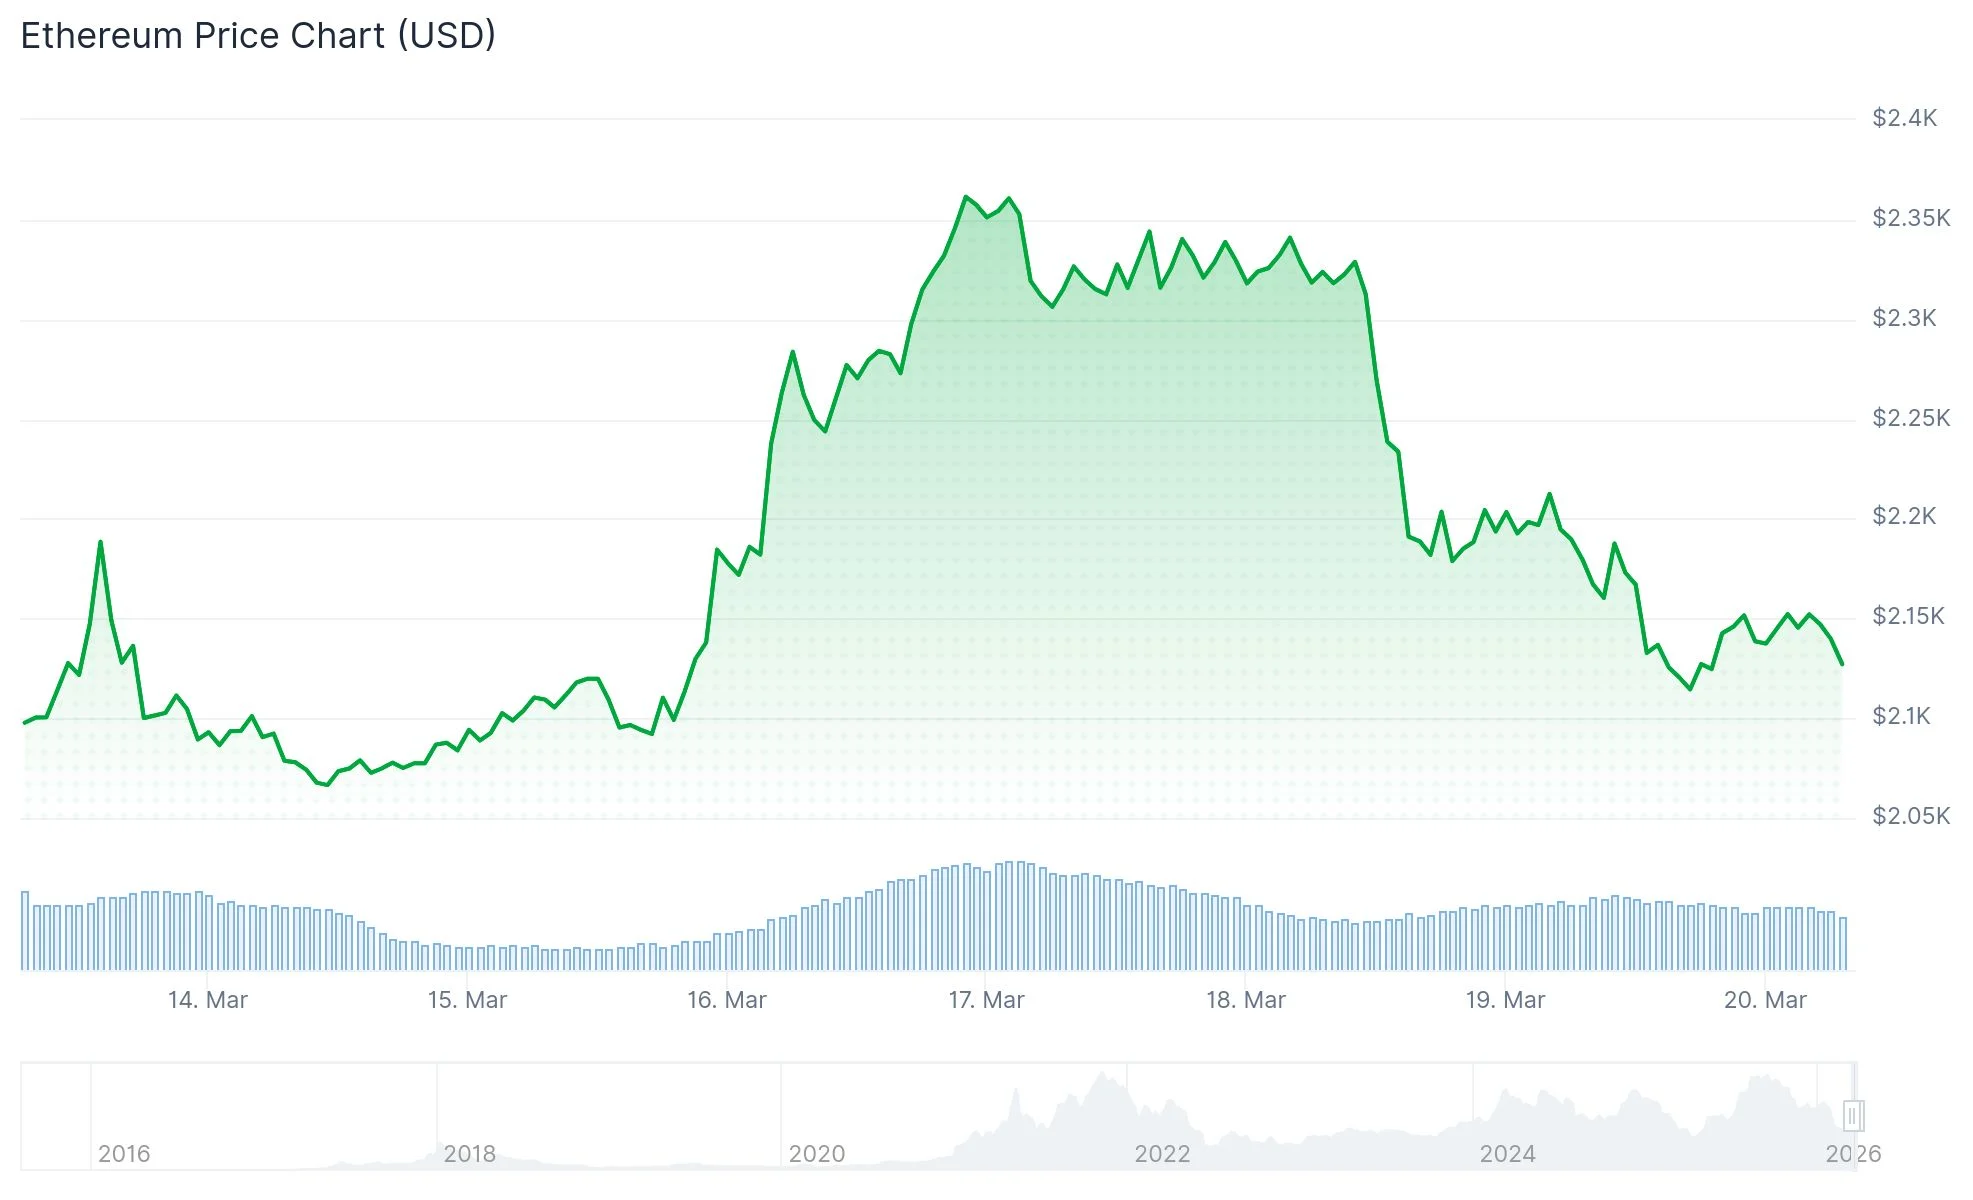
The recent session low touched $2,100. ETH now trades just above this threshold, positioned below the 23.6% Fibonacci retracement level measured from the $2,385 high to the $2,100 low.
The asset remains beneath its 100-hour Simple Moving Average, reinforcing the near-term bearish momentum in play.
Immediate resistance appears at $2,165, with the next significant barrier at $2,200, coinciding with the 100-hour SMA. Reclaiming the $2,200 threshold represents the initial requirement for any meaningful recovery.
Should Ethereum breach $2,200, additional resistance targets include $2,240, aligned with the 50% Fibonacci retracement, followed by $2,275 and $2,320. Extended strength could challenge the $2,385 level.
Regarding downside risk, a breakdown below $2,100 would expose support zones at $2,060 and $2,020. The psychological $2,000 mark stands as major support.
On-Chain Metric Signals Historical Value Territory
From a broader perspective, Ethereum’s Market Value to Realized Value ratio has descended into the 0.8 to 1.0 territory. Market analyst Ali Charts, utilizing Glassnode data, identifies this range as historically significant, often preceding substantial multi-month rallies.
https://twitter.com/alicharts/status/2034559606668570900?s=20
Historical recoveries from this MVRV zone have produced gains ranging from approximately 129% to exceeding 5,000%, though market conditions varied considerably across cycles. While this indicator doesn’t guarantee immediate price appreciation, it suggests limited downside potential compared to elevated valuation levels.
ETH achieved a cycle peak near $4,955 before entering the current correction phase. Trading around $2,100 marks a decline exceeding 57% from that high.
Technical Analyst Highlights $2,150 Critical Zone
Market analyst Ted Pillows shared insights on X regarding Ethereum’s technical position. He emphasized that ETH experienced strong resistance at the $2,400 level and is now challenging $2,150 as potential support.
https://twitter.com/TedPillows/status/2034554720593772615?s=20
The technical chart presented by Ted Pillows illustrates a series of descending peaks, with each recovery attempt failing to generate sustained upward movement. This formation suggests additional downside risk remains viable if support zones fail.
The $2,150 region corresponds to a previous consolidation area and serves as an important short-term inflection point for traders.

