
 Surges Past $2,200 as Short Squeeze and ETF Inflows Drive Price Recovery")
Quick Summary
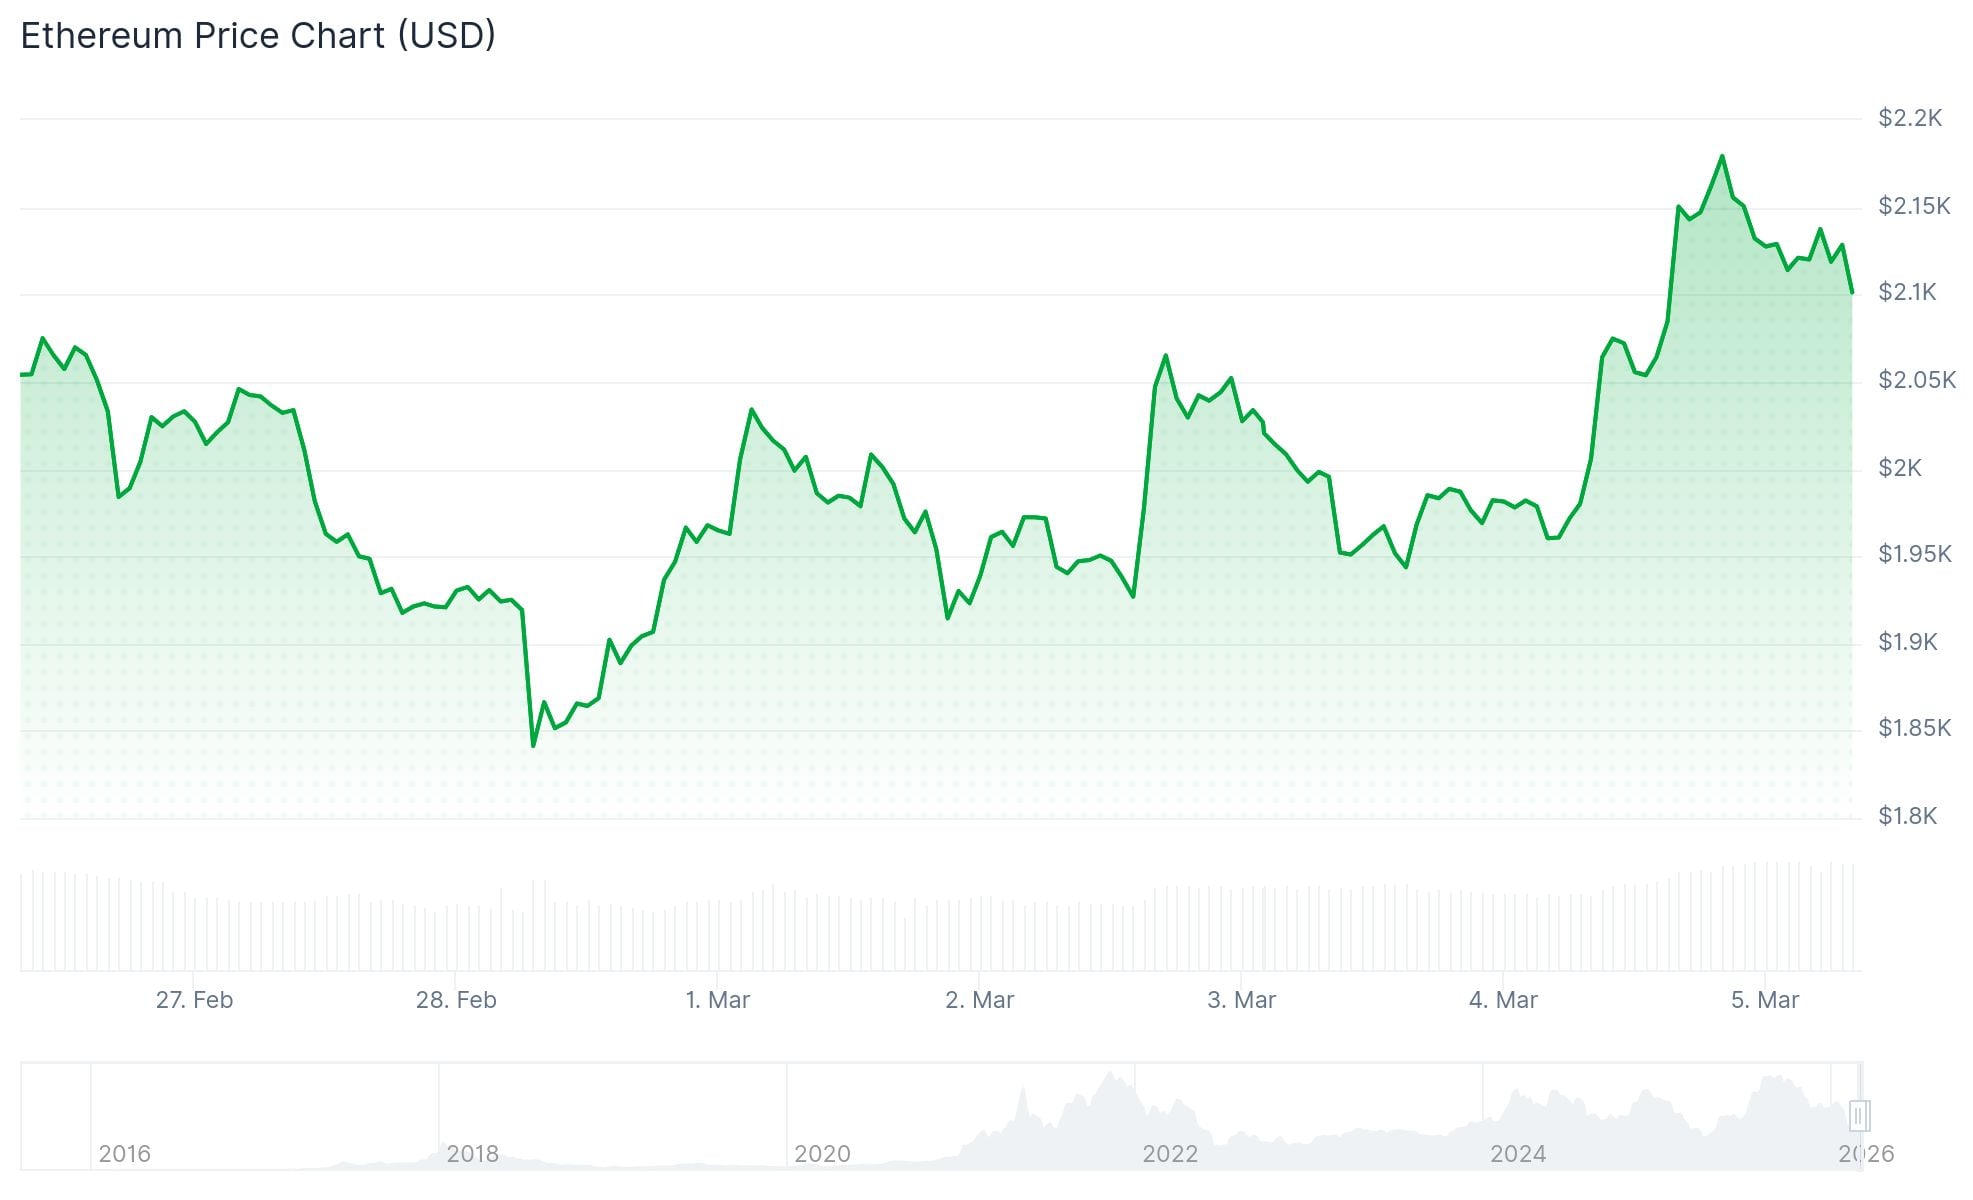
- Ethereum surged past $2,100 to reach a 4-week peak of $2,192 amid broad crypto market strength
- A massive short squeeze saw more than $133 million in bearish positions liquidated within 24 hours
- Spot Ethereum ETFs attracted $169.4 million in net inflows in one day, signaling renewed institutional interest
- Derivatives open interest surged nearly 15% to 13.43M ETH, marking the highest level since late January
- Critical resistance zone lies between $2,150 and $2,200; a clean break could send ETH toward $2,400 and potentially $2,750
Ethereum (ETH) has reclaimed territory above the $2,100 mark this week, pushing to a four-week high of $2,192 as digital asset markets experienced a widespread recovery.
The upward momentum gained traction following reports suggesting potential diplomatic dialogue between the United States and Iran, which boosted risk appetite across financial markets.
Bitcoin spearheaded the rally, breaking back above $73,000 for the first time in over a month. Ethereum quickly followed suit, posting gains exceeding 11% over a 24-hour span.
ETH’s trading volume surged by 24% during this timeframe, representing approximately 12% of the token’s total circulating market capitalization.
This price surge caught bearish traders off guard, resulting in substantial short position liquidations. Data from CoinGlass reveals that over $133 million in short positions were forcibly closed within 24 hours, while long liquidations totaled only $21.5 million.
Short liquidations reached their peak since late February, climbing to $430 million across the market. Ethereum-specific shorts accounted for roughly $100 million of this total, indicating a powerful short squeeze was underway.
Institutional Capital Flows Back to ETH
Spot Ethereum ETF products saw remarkable inflows of $169.4 million in a single trading session, based on data compiled by Farside Investors. This influx points to heightened institutional participation during the price rally.
Derivatives open interest for ETH jumped nearly 15% to reach 13.43M ETH — the strongest reading since the final day of January. This metric has expanded by 1.2M ETH during the past two weeks alone.
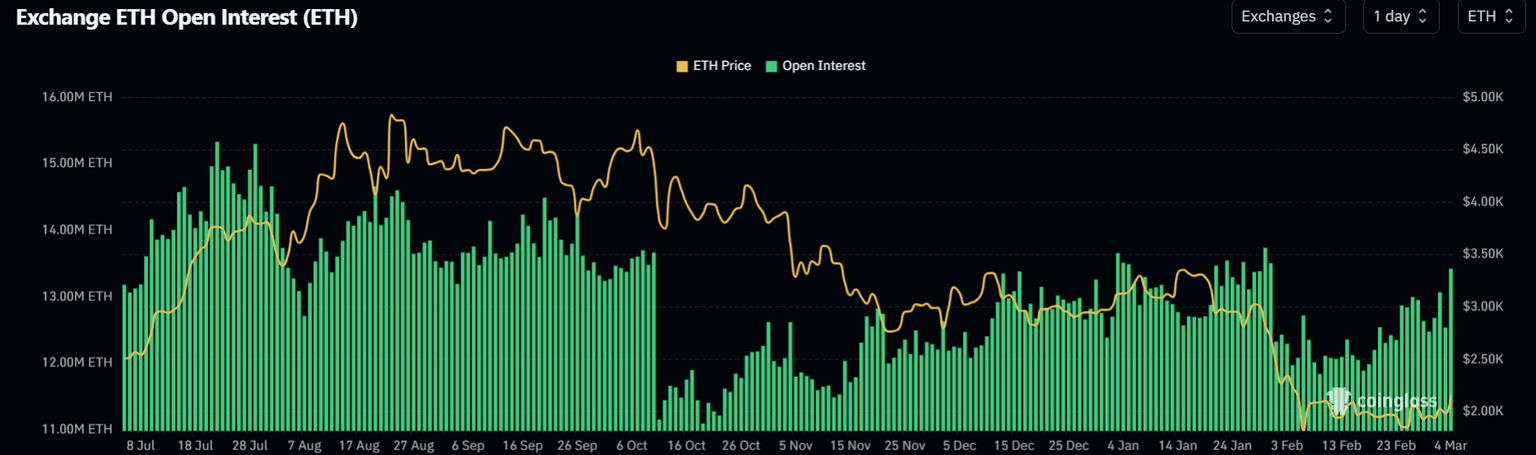
While funding rates currently hover in slightly negative territory at press time, market observers suggest that a rotation toward positive rates would signal a definitive return of bullish market sentiment.
Key Price Levels for Ethereum Traders
Analyzing the daily timeframe, Ethereum has developed a classic double bottom formation. The pattern’s neckline resistance is positioned at $2,200, representing a significant psychological barrier.
Successfully breaking through the $2,200 threshold could propel ETH toward $2,400, which corresponds with the 38.2% Fibonacci retracement from recent highs.
The Relative Strength Index currently reads 53, positioned above neutral territory, indicating strengthening momentum following several weeks of oversold conditions.
The MACD indicator has printed a bullish crossover signal, while the Aroon Up metric registered 92.86%, significantly outpacing the bearish Aroon Down reading of 35.71%.
Ethereum’s realized price — representing the average acquisition cost across all on-chain holders — hovers around $2,300. Approaching this threshold may trigger profit-taking as investors seek to exit at breakeven levels.
Near-term support is established at $2,108, coinciding with the 20-day exponential moving average. Falling beneath this level could expose ETH to a potential decline toward $1,741.
At publication time, ETH was changing hands at $2,117, sitting just 1.1% beneath the 23.6% Fibonacci level at $2,142.

