

TLDR:
- Ethereum price trades just above $4,000 after a 12.5% weekly drop, signaling possible extended correction.
- Analyst sees $3,635 as next critical support with $3,350–$3,160 range as possible bottom before rebound.
- RSI at 71.1 signals near-overbought levels, aligning with expected short-term pullback before continuation.
- Breaking $4,500 resistance could trigger bullish continuation toward $4,676 if buyers regain control.
Ethereum is clinging to the $4,000 level after a rough week of selling pressure. Traders are watching closely as price action signals the market might not be done correcting.
Momentum is slowing, and buyers are cautious after repeated rejections near $4,500. Key chart levels now decide where price moves next.
Market analyst MarketMaestro said in a recent update that ETH is retesting its fair value gap (FVG). This is a common move before a continuation or deeper drop. He warned that price might revisit lower support zones before reversing.
His view lines up with the market’s current mood, where participants expect some cooling off before the next move.
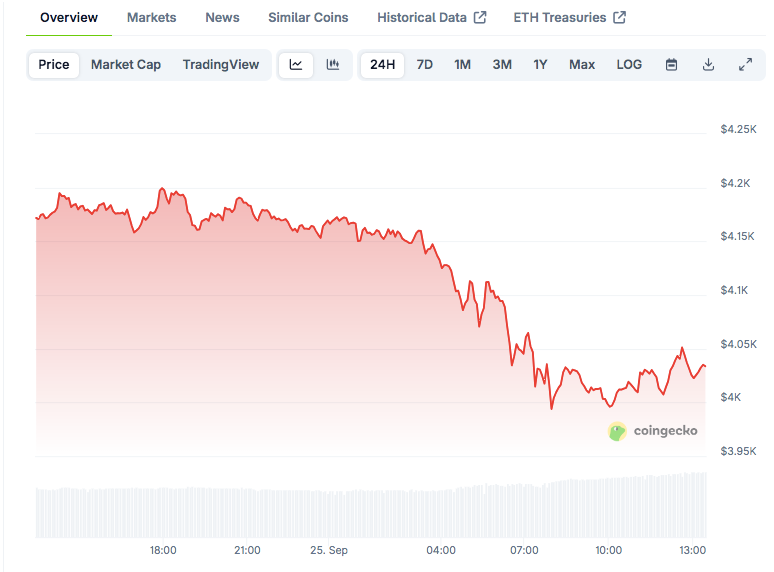
According to CoinGecko, Ethereum trades at $4,026.76 after falling 3.69% in 24 hours and over 12% in the past week. That puts the coin in a correction phase after a strong rally earlier this month. Traders are now watching $3,635 as the next key area to hold.
Ethereum Price Levels to Watch Now
The $4,000 level remains the first defense line for buyers. MarketMaestro’s chart shows strong buying interest here, but it might not hold forever. A clean break below this zone would likely send price toward $3,635.
He said the $3,350–$3,160 area could emerge as new support if selling continues. This would form a potential bottom before a reversal. Price often fills these gaps before resuming an uptrend, and ETH has followed this pattern before.
Volume profiles confirm buyers are active near $4,000, though selling pressure is still present. If price bounces strongly from these zones, it could set the stage for a move back to $4,500. But if sellers break through, the next test could come at $3,400, a level many traders see as crucial.
$ETH
In my previous post, I mentioned that there was a double top+negative divergence, and exhaustion. It needs a correction. As you can see on the chart, it is moving forward by retesting the FVG. This price action is very natural. I would also consider another FVG retest as… https://t.co/9ePMPBZvAF pic.twitter.com/R1hmXbyxrX— MarketMaestro (@MarketMaestro1) September 25, 2025
RSI, Trend, and Potential Reversal
The Relative Strength Index (RSI) on the chart sits at 71.1. This shows ETH is close to overbought conditions and might need a reset. MarketMaestro’s earlier note on negative divergence supports this view.
The trend still looks broadly bullish on higher timeframes, but short-term correction risks remain. If ETH holds above $3,635 and builds strength, the next upside target sits near $4,676. A strong breakout above $4,500 would confirm this setup.
Until then, traders expect ETH to keep ranging and retesting FVG zones. This could last a while before a proper breakout happens. Buyers want to see fresh momentum before committing to the next leg higher.

