

TLDR:
- HBAR retested crucial support near $0.24, offering a potential buying opportunity after recent price swings.
- Hedera’s chart shows a three-wave move off lows, hinting at a possible fourth wave forming next.
- Breaking above $0.32 resistance may unlock upside toward $0.36-$0.40 for HBAR investors.
- Buying at resistance in a three-wave move could lead to pullbacks, making retests more favorable.
Hedera Hashgraph (HBAR) is showing early signs of potential momentum after recent chart activity suggested a retest of key support.
The cryptocurrency has moved off its lows, and analysts now point to resistance levels as critical points for the next push. Investors are closely watching price action to determine entry opportunities and potential upside.
Recent commentary from crypto analyst Hov highlighted wave structures that may influence short-term trading strategies. The market remains active, with price fluctuations reflecting both buying pressure and caution among traders.
Hedera Price Chart Shows Retest and Potential Upside
Hov noted in a recent tweet that HBAR successfully retested a blue entry level, which previously indicated strong support. The chart suggests the coin has completed a three-wave move from its recent lows.
The analyst believes this structure could lead to a fourth wave forming soon, potentially setting the stage for another upward push. The critical resistance near $0.32 remains a focus for traders seeking confirmation of further upside.
The retest of the support line around $0.24 has historically held during dips, providing a reference point for potential entries. Hov advised caution against buying at resistance levels, particularly during a three-wave move, as pullbacks remain possible. If $HBAR breaks above $0.32 with sustained momentum, the next target range could reach $0.36-$0.40. This scenario would unlock additional upside for short-term investors looking for price acceleration.
In the last update we were looking for HBAR to retest our blue entry level (threaded)
Since then we got the retest and then it ran for 100+%
As of now it's only 3 waves off the low so we need to see it get another push higher above our key resistance level on 5 waves… pic.twitter.com/iCxnnb3fXm
— Hov (@HovWaves) August 27, 2025
Market Participants Track HBAR Wave Patterns
According to Hov, the current price action is potentially the fourth wave of the third cycle in the chart. Traders observing this pattern may consider waiting for a retest of support before entering.
The chart suggests immediate resistance may challenge buying pressure, making patience a key factor. Analysts point out that a confirmed breakout above the resistance zone could trigger further upward movement in price.
Hedera’s price has been affected by overall market dynamics, yet the chart indicates a defined trend that traders can use for planning. Momentum above the red-marked resistance could validate bullish patterns, attracting additional activity.
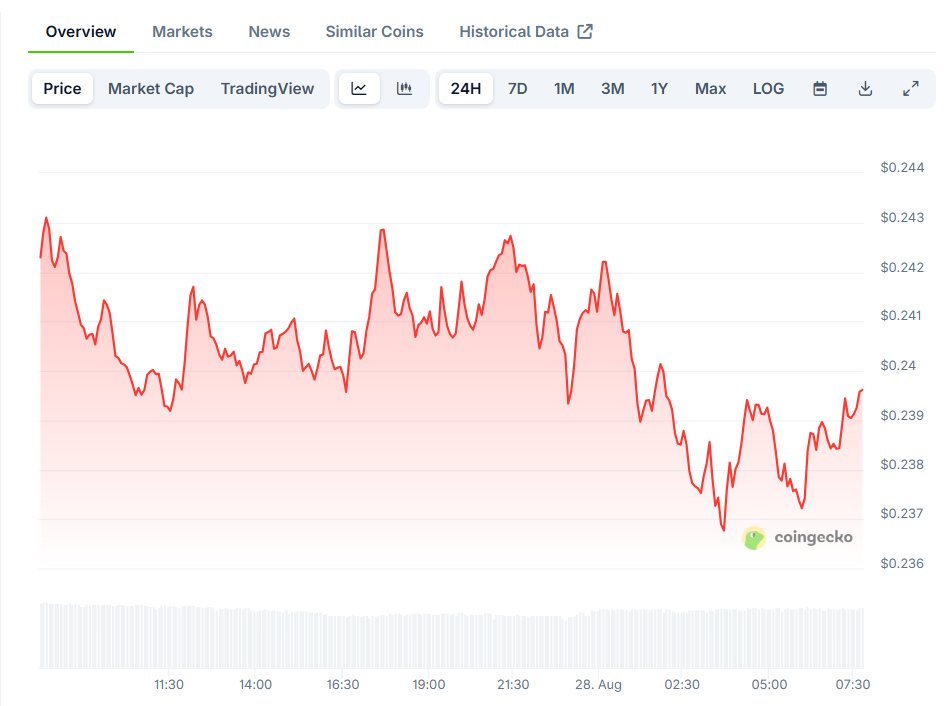
Hov emphasized that timing entry points based on wave completion and retests can help manage risk. Market data from Coingecko shows HBAR trading at $0.2392, reflecting a 1.11% dip over 24 hours and a slight weekly decline.
Short-Term Outlook and Trading Strategy
For investors, monitoring the five-wave move above key resistance is critical. Breaking above the immediate resistance level could unlock further upward momentum.
Conversely, buying at the resistance could result in temporary pullbacks. Hov’s analysis underscores the value of watching retests for potential entries that align with the ongoing wave patterns.
Traders should follow updates and chart signals closely, as HBAR demonstrates both support strength and potential for growth. Short-term momentum may accelerate if key levels are breached, influencing trading decisions in the coming sessions.
Overall, Hedera’s chart activity provides measurable points for risk management and strategic entries.

