TLDR:
- A whale with a flawless record just opened a $131.8M Ethereum long, fueling talk of a strong market rally.
- Technical charts suggest Ethereum’s wave five could push prices toward $5,940 and possibly $7,400.
- Ethereum trades near $3,969 after holding major support, reinforcing a bullish structure across timeframes.
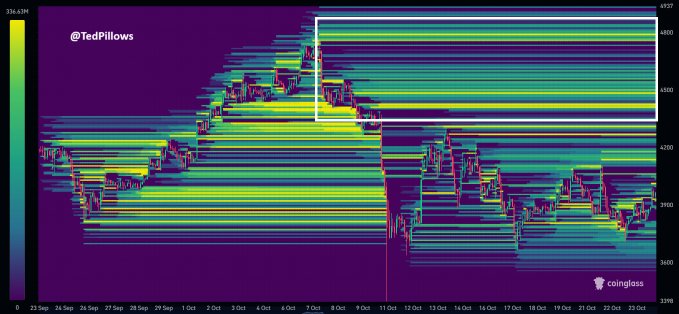
- High liquidity above $4,200 could ignite Ethereum’s next breakout phase.
Ethereum is back in the spotlight. A major whale just opened a $131.8 million long position, stirring talk of a major move. The trader, known for an unbroken record of profitable trades, has made $16 million in just two weeks.
Analysts are now watching for a potential wave five push that could send prices far higher. With technicals aligning and market sentiment shifting, investors are wondering whether a massive Ethereum rally is on the horizon.
Whale Bets and Technical Signals Point Toward Higher Ethereum Price
Crypto analyst Ash Crypto reported that a trader with a perfect track record has gone long on $ETH for $131.8 million.
This move comes as Ethereum holds near $3,969, marking a 5% gain in the past week, according to CoinGecko. The position suggests high confidence that the market could be gearing up for a strong upward move.
Stockmoney Lizards shared that ETH’s current price behavior mirrors a classic five-wave impulse pattern.
The correction phase, labeled wave four, is viewed as a normal pause before wave five resumes the uptrend. Based on Fibonacci Extensions, analysts are targeting $5,940, with a possible extension toward $7,400 if momentum builds.
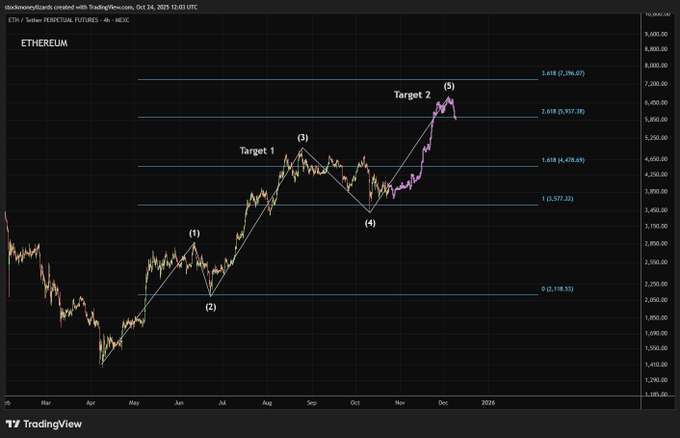
Market watchers say a shallow correction would keep the structure intact. If prices hold above the current base, bulls could regain control quickly. The chart still favors the upside, provided no sharp breakdown occurs below the recent low.
Traders Eye $6,000 Target as Ethereum Breaks Key Levels
Market technician Michael Ceasar stated that Ethereum has cleared major resistance on the three-month chart, confirming a bullish setup.
He noted that when resistance becomes support, it often marks the start of a strong continuation move. Ceasar’s analysis points to $6,200 as the next target if momentum persists.
On the weekly timeframe, Ethereum’s price action shows it retesting the breakout area. Holding above this level is crucial, as a breakdown could invalidate the bullish structure. The daily chart, however, continues to show a supportive setup with a visible trendline and strong demand zone.
In shorter timeframes, a triple bottom has formed, suggesting the retracement phase may be ending. A confirmed breakout above local resistance could trigger a new wave of buying.
According to Ted, a crypto trader on X, liquidity clusters above $4,200 may lead to short squeezes if buying pressure increases. Many traders turned bearish earlier this month, but sentiment could shift quickly if Ethereum breaks key resistance levels.