

After thousands of hours of development and months of testing, we have finally released the second major iteration of our cryptocurrency market tracker!
If you’ve visited our landing page over the past week you’ve likely noticed the new design, but you might be wondering, what’s new? How will our new design help you track the Bitcoin and cryptocurrency markets better than before?
Please Note: This is a Press Release
Let’s take a look.
Biggest Issue in the Crypto Market Today
Live Coin Watch’s update is centered around providing more information from more sources and thus improving transparency for digital asset markets and cryptocurrencies themselves. Unlike regulated financial markets, where trading volume is known to indicate different levels of liquidity, cryptocurrency markets are rife with inaccuracies and false data. Due to the largely unregulated nature of this market, there is an evident prevalence of wash trading on a majority of crypto exchanges, which makes volume no longer an adequate indicator of liquidity.
In fact, a 2018 report from cryptocurrency investment services firm Bitwise Asset Management found that a jaw-dropping 95% of Bitcoin volumes reported can be defined as “wash trading” or “fake volumes.” In a seminal report titled “The Real Bitcoin Market,” the firm found that “suspicious exchanges” use wash trading strategies like “trade printing” to artificially inflate their volume, and thus the confidence that investors have in these markets.

Bringing Transparency to Investors
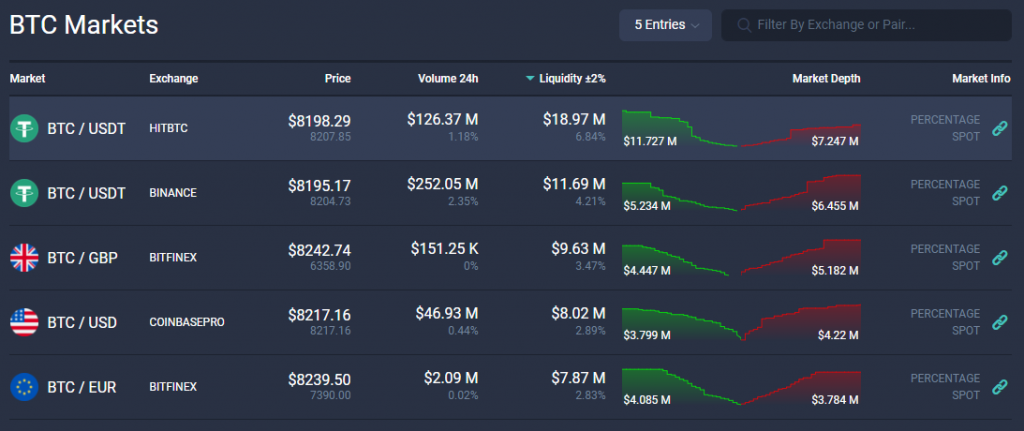
Live Coin Watch is aiming to fix, or at least raise awareness of, this rampant issue. By reporting liquidity for all exchanges through their order book APIs, users can now see how liquid or illiquid an exchange or market actually is, allowing for users to make more measured investment decisions. For each order book, we now collect data to calculate the spread and slippage cost — the amount of capital needed to move the markets by 2%.
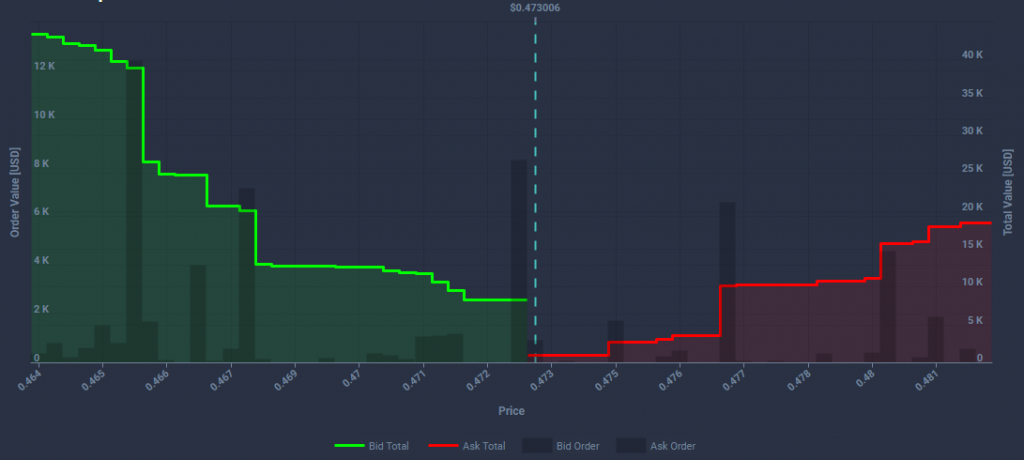
With this new update, all markets on our site will have reported 2% slippage costs, all exchanges now report aggregate exchange liquidity, and all coins now support real-time aggregate depth charts, which are calculated by summing the liquidity of each of their respective markets.
We wanted to emphasize liquidity metrics to provide more insight into exchanges’ actual trading activity. Some of the additional features, tools, tidbits of information, and data sets to increase transparency for exchanges are as follows:
- Average volume per user
- Historical volume data
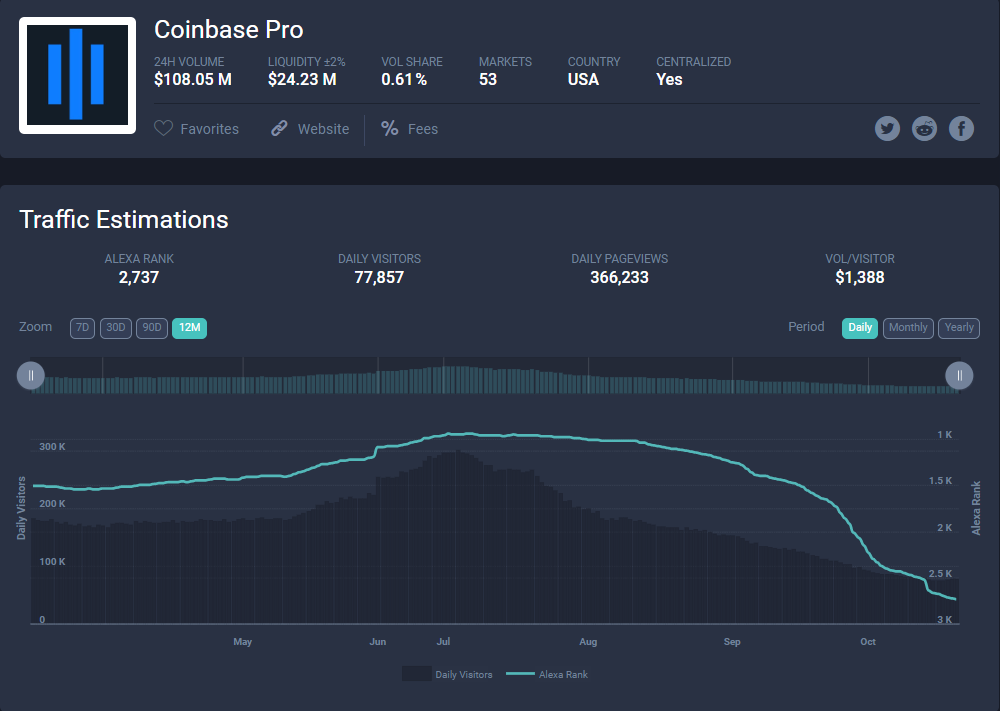
- Traffic to the website of exchanges
- Amazon Alexa rankings (a measure of web traffic/demand)
- Total exchange liquidity & breakdown by bids/asks (±2%)
- Links to exchange social pages and fee pages
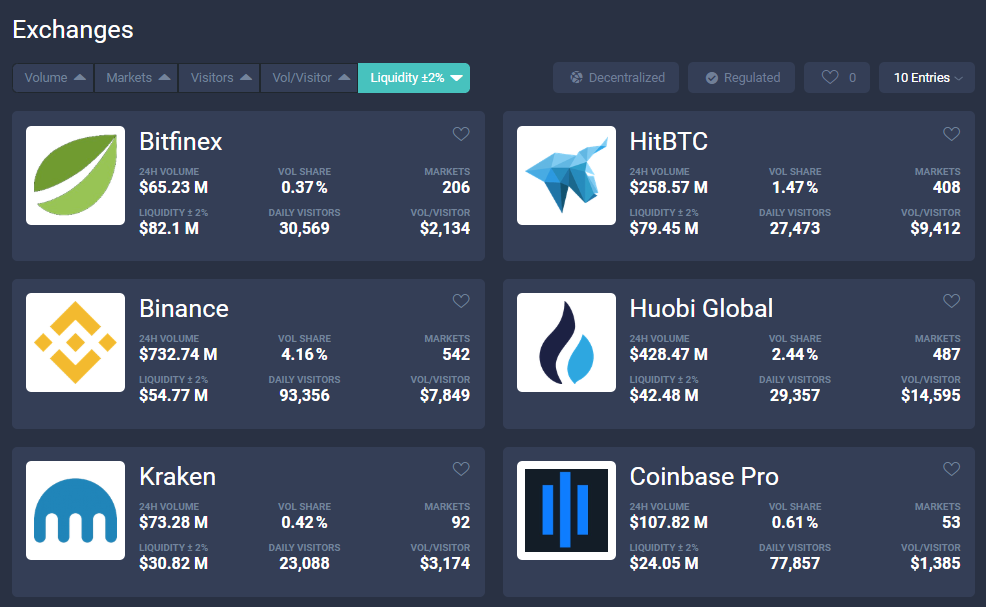
- Exchanges are sortable by trade volume, market count, daily visitors (to exchange website), average volume per visitor, and market liquidity.
- Filter to easily find licensed, decentralized, and favorite exchanges
These new traffic and liquidity stats should be considered when one is seeking a new exchange to trade on. In the unregulated crypto industry, the reported trade volume is swiftly becoming a useless metric. The sad truth is that small exchanges are forced to conduct wash trading just to keep up with the others and their bogus stats. We highlight these new metrics and favor liquidity over volume wherever possible to give ethical platforms the fighting chance they deserve.
We will soon be launching a newsletter to cover the latest price updates and news events in the cryptocurrency and blockchain industry. Make sure to sign up at the bottom of our page. It’s free, anyway, so why not?
And as always we are constantly looking for ways to improve our site. We welcome all suggestions, feedback, and snarky comments on Twitter, Telegram, and Reddit.

