

TLDR:
- Multicoin and partners raised $680M on-chain to acquire Solana, signaling strong institutional interest.
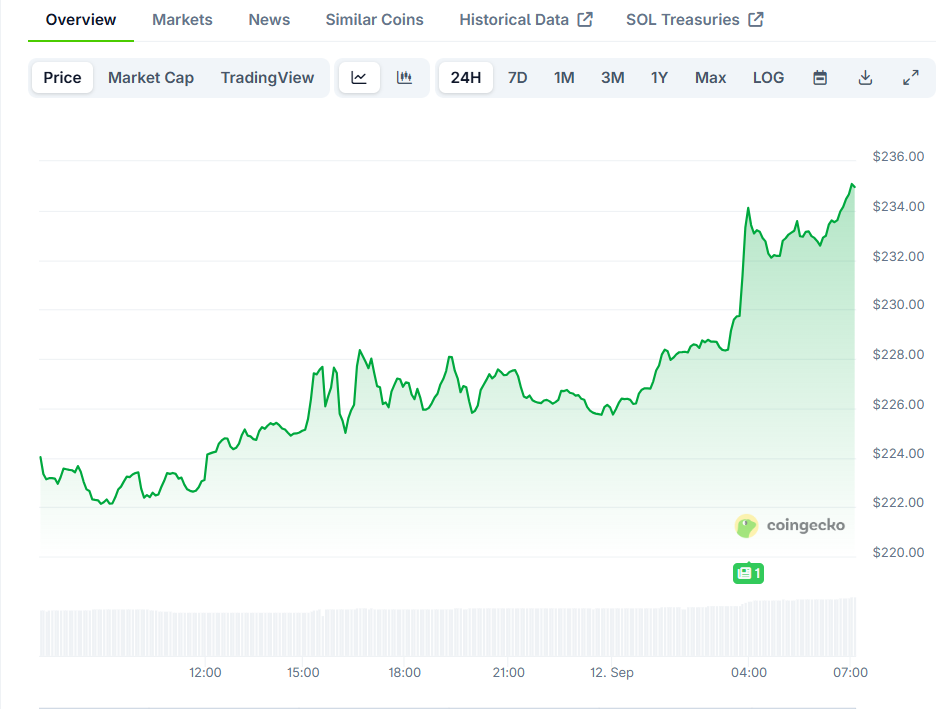
- Solana price hits $234.66, rising 15% over the past week amid high trading activity.
- Technical indicators show SOL near resistance with a rising wedge pattern forming on 1D chart.
- Daily close above $234 with volume could push Solana toward $261 in short-term trading.
Solana (SOL) has drawn fresh interest from institutional investors as market activity accelerates. Forward Industries and Multicoin coordinated a major on-chain fund movement totaling $680 million.
The funds were transferred to Galaxy Digital to support Solana acquisition strategies. This move follows Forward Industries’ $1.65 billion private placement for cash and stablecoin commitments.
Traders are now monitoring price action closely as SOL tests key resistance levels.
Multicoin and Forward Industries Drive Solana Price
Arkham first reported the $680 million on-chain movement, identifying Forward Industries as the source. The transactions are part of Multicoin’s $1.6 billion Solana DAT, with Jump Crypto and Galaxy Digital as participants.
Mission moon $SOL continues!
Expecting DATs for whole top 10-20 tokens in coming weeks! https://t.co/fAn7EKg05R
— Momin (@mominsaqib) September 11, 2025
Forward Industries previously confirmed the private placement aimed at advancing Solana treasury strategies. Market participants are watching how these large-scale purchases influence supply and demand dynamics.
The transfer to Galaxy Digital underscores growing institutional appetite for Solana. Investors appear focused on both long-term treasury accumulation and short-term price support. This strategic coordination could affect SOL liquidity across major exchanges.
The scale of the transactions indicates confidence in Solana’s near-term potential.
Solana’s price responded positively, climbing 4.57% in the last 24 hours. CoinGecko data shows SOL at $234.66 with over $11 billion in 24-hour trading volume.
The surge reflects both market momentum and anticipation of further technical developments. Such moves could set the stage for higher short-term targets.
Solana Price Trends and Technical Signals
Karan Singh Arora highlighted a rising wedge pattern forming on SOL’s daily chart. Price is testing the upper trendline, while volume trends show bearish divergence.
The relative strength index nears 65, suggesting overbought conditions. Traders are cautious as rejection from $232–$234 could trigger a move down to $184.
On the other hand, a daily close above $234 with strong volume may target $261. The market is evaluating whether institutional purchases will provide sustained momentum.
SOL’s technical indicators, combined with the on-chain fund movements, are creating heightened trading interest. Investors now track both price patterns and volume to gauge market direction.
🚨 $SOL UPDATE 👇
Rising wedge pattern forming here on 1D
SOL is trading near resistance, testing the upper trendline of a rising wedge, While price action looks strong, there are warning signs to watch :
Bearish Volume Divergence: Price making higher highs, volume making… pic.twitter.com/nSY4hqWANA
— Karan Singh Arora (@thisisksa) September 11, 2025
Forward-looking traders will watch the wedge’s upper limit and potential breakouts. Short-term rallies depend on sustained buying pressure. SOL’s recent climb demonstrates the influence of coordinated institutional activity on crypto price movements. Analysts emphasize careful monitoring of both support and resistance levels for strategic trades.
Get 3 Free Stock Ebooks
Discover top-performing stocks in AI, Crypto, and Technology with expert analysis.
- Top 10 AI Stocks - Leading AI companies
- Top 10 Crypto Stocks - Blockchain leaders
- Top 10 Tech Stocks - Tech giants


