

TLDR
- SOL retreated from $90 to test support around $85 before stabilizing near $87
- The Relative Strength Index reads 47.68 — indicating neutral momentum without decisive bullish pressure
- For the first time since January, SOL has moved back above the Ichimoku cloud on 4-hour timeframes
- Technical observers identify $88.60 as a critical resistance threshold; clearing it may trigger moves toward $95–$100
- A bullish crossover occurred as the 50MA moved above the 100MA, suggesting improving short-term momentum
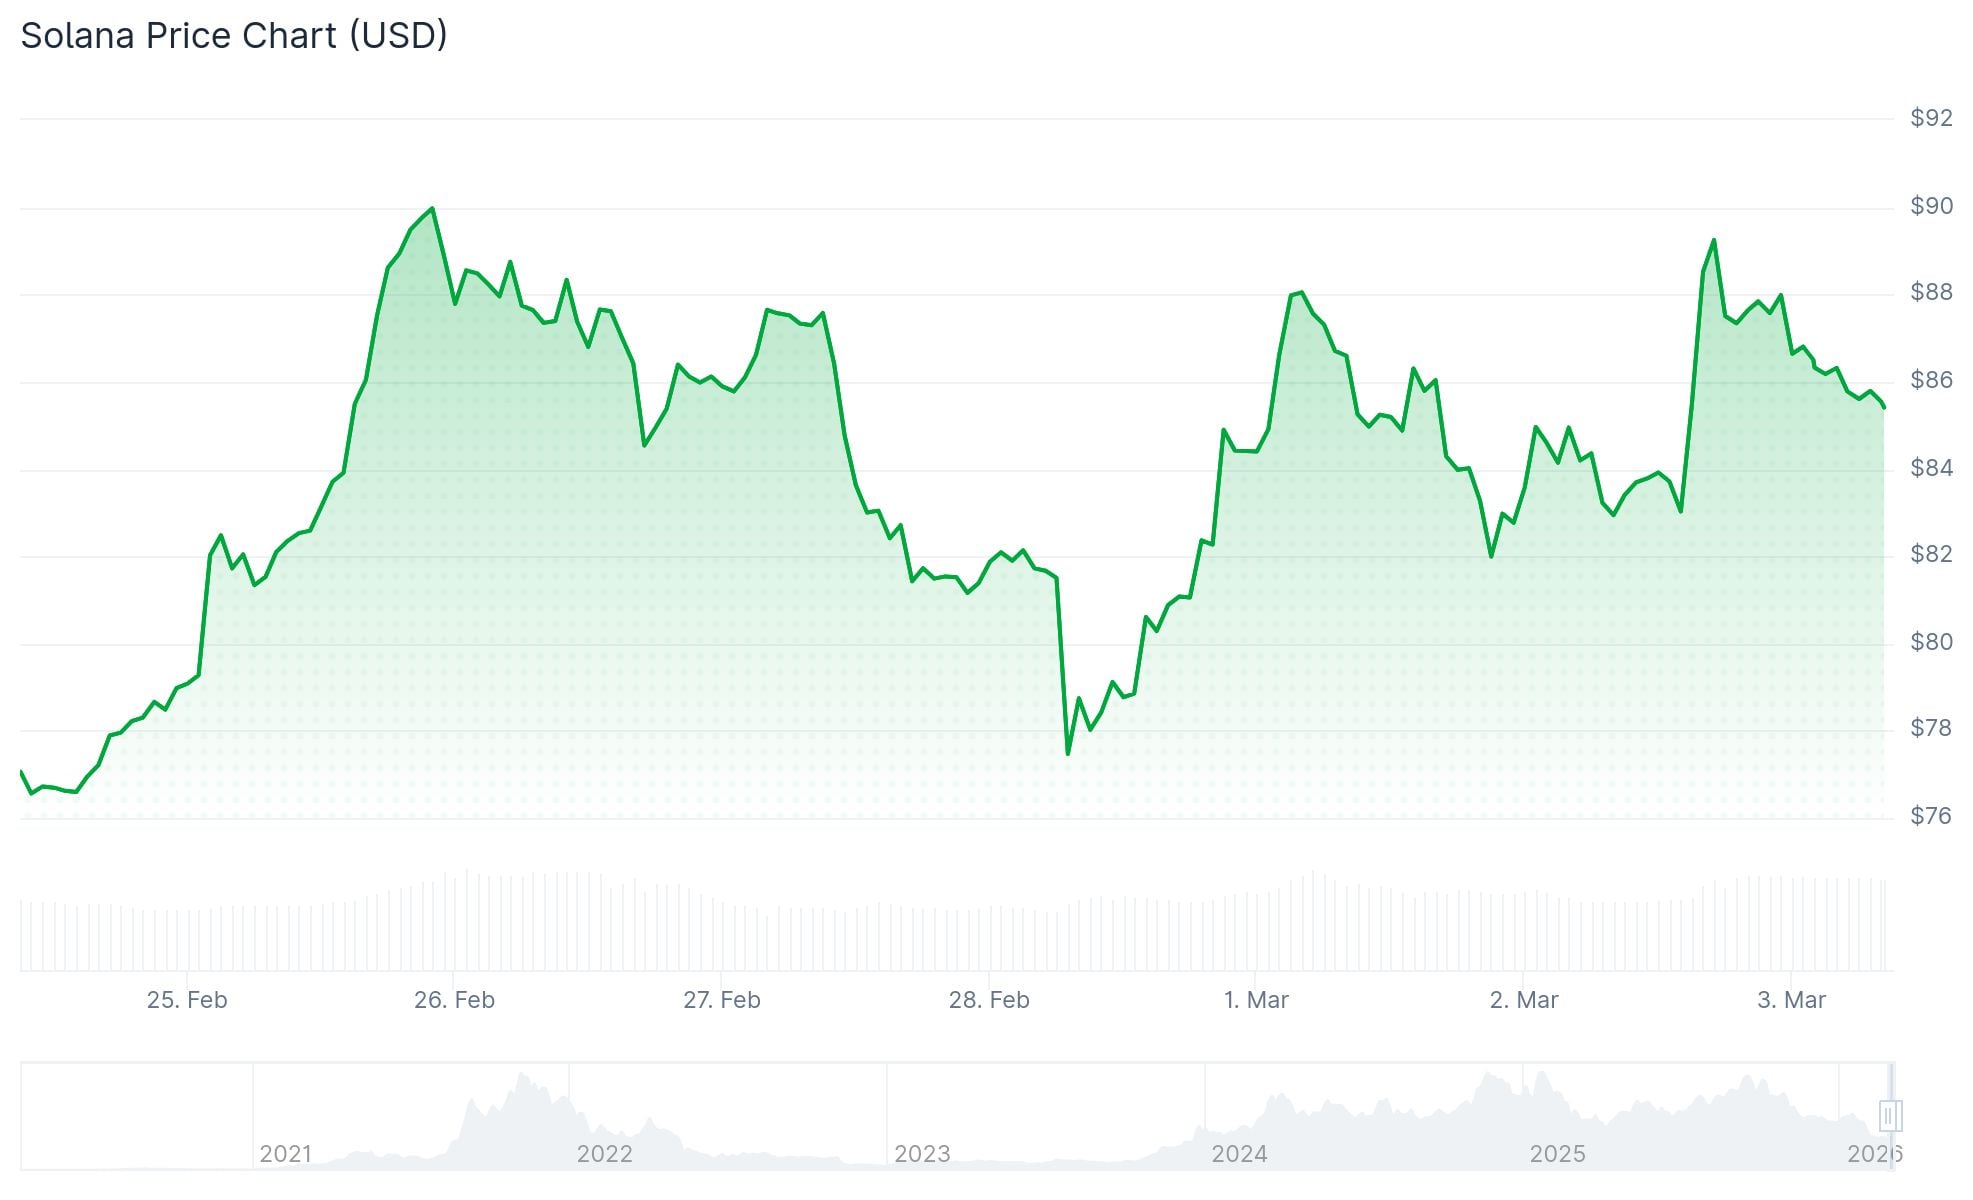
Solana (SOL) is currently changing hands in the $87–$88 range following a retreat from its recent peak of $90.29. The digital asset tested levels below both $88 and $87 before stabilizing above the crucial $85 support zone.
The token maintains its position above the 100-hourly simple moving average at present. Trading activity over the past day totals $9.99 billion in volume, while market capitalization stands at $49.91 billion. Price action reflects a 4.70% gain across the 24-hour period.
This recent retracement pushed SOL beneath the 50% Fibonacci retracement level calculated from the $81.71 low to the $90.29 high. Chart technicians have identified a bullish trend line developing on hourly timeframes, with support clustering near $85—a level that coincides with the 61.8% Fibonacci retracement.
On March 2, market analyst BitGuru suggested that SOL might be transitioning from correction into consolidation territory. His assessment highlighted the formation of higher lows near established support zones, indicating diminishing downside momentum.
Technical observers have zeroed in on $88.60 as the immediate level that needs reclaiming. According to market commentator More Crypto Online, a successful push above Sunday’s high at $88.60 would demonstrate renewed buyer strength.
Key Resistance Levels to Watch
Immediate resistance appears at $88, followed by $90 and $92. Successfully closing above $92 would potentially clear the way for tests of $96 and subsequently $100.
Should SOL struggle to overcome the $90 barrier, downside targets emerge at $84 and then $82. Breaking below $82 could expose the token to further weakness toward $76.50.
The Relative Strength Index currently registers 47.68—positioned in neutral territory without extreme conditions. The MACD indicator shows 1.80, marginally positive but still trailing the signal line at -4.29. While bearish pressure appears to be diminishing, bullish momentum hasn’t fully established dominance.
Solana remains positioned considerably below its major moving averages across longer timeframes. The 50-day SMA stands at $103.66, while the 100-day rests at $117.73, and the 200-day sits at $156.34.
Ichimoku Cloud Break Signals Shift
Analyzing the 4-hour timeframe reveals that SOL has successfully reclaimed position above the Ichimoku cloud—marking the first such occurrence since January. During the entire month of February, all upward movements met resistance at this cloud formation.
Additionally, the 50-period moving average has executed a bullish crossover above the 100-period moving average on 4-hour charts. Technical analyst CryptoCurb characterized this development as representing a meaningful shift in underlying trend structure.
Both moving averages are now beginning to slope upward. Chart projections presented by CryptoCurb indicate potential for movement toward $100 and higher levels, provided the token sustains its position above recently reclaimed technical zones.
Currently, SOL is valued at $87.64 with preliminary recovery indicators emerging, though a definitive trend reversal remains unconfirmed at this stage.

