
 Price Analysis: Critical Levels Emerge as ETF Outflows Accelerate in April")
Key Takeaways
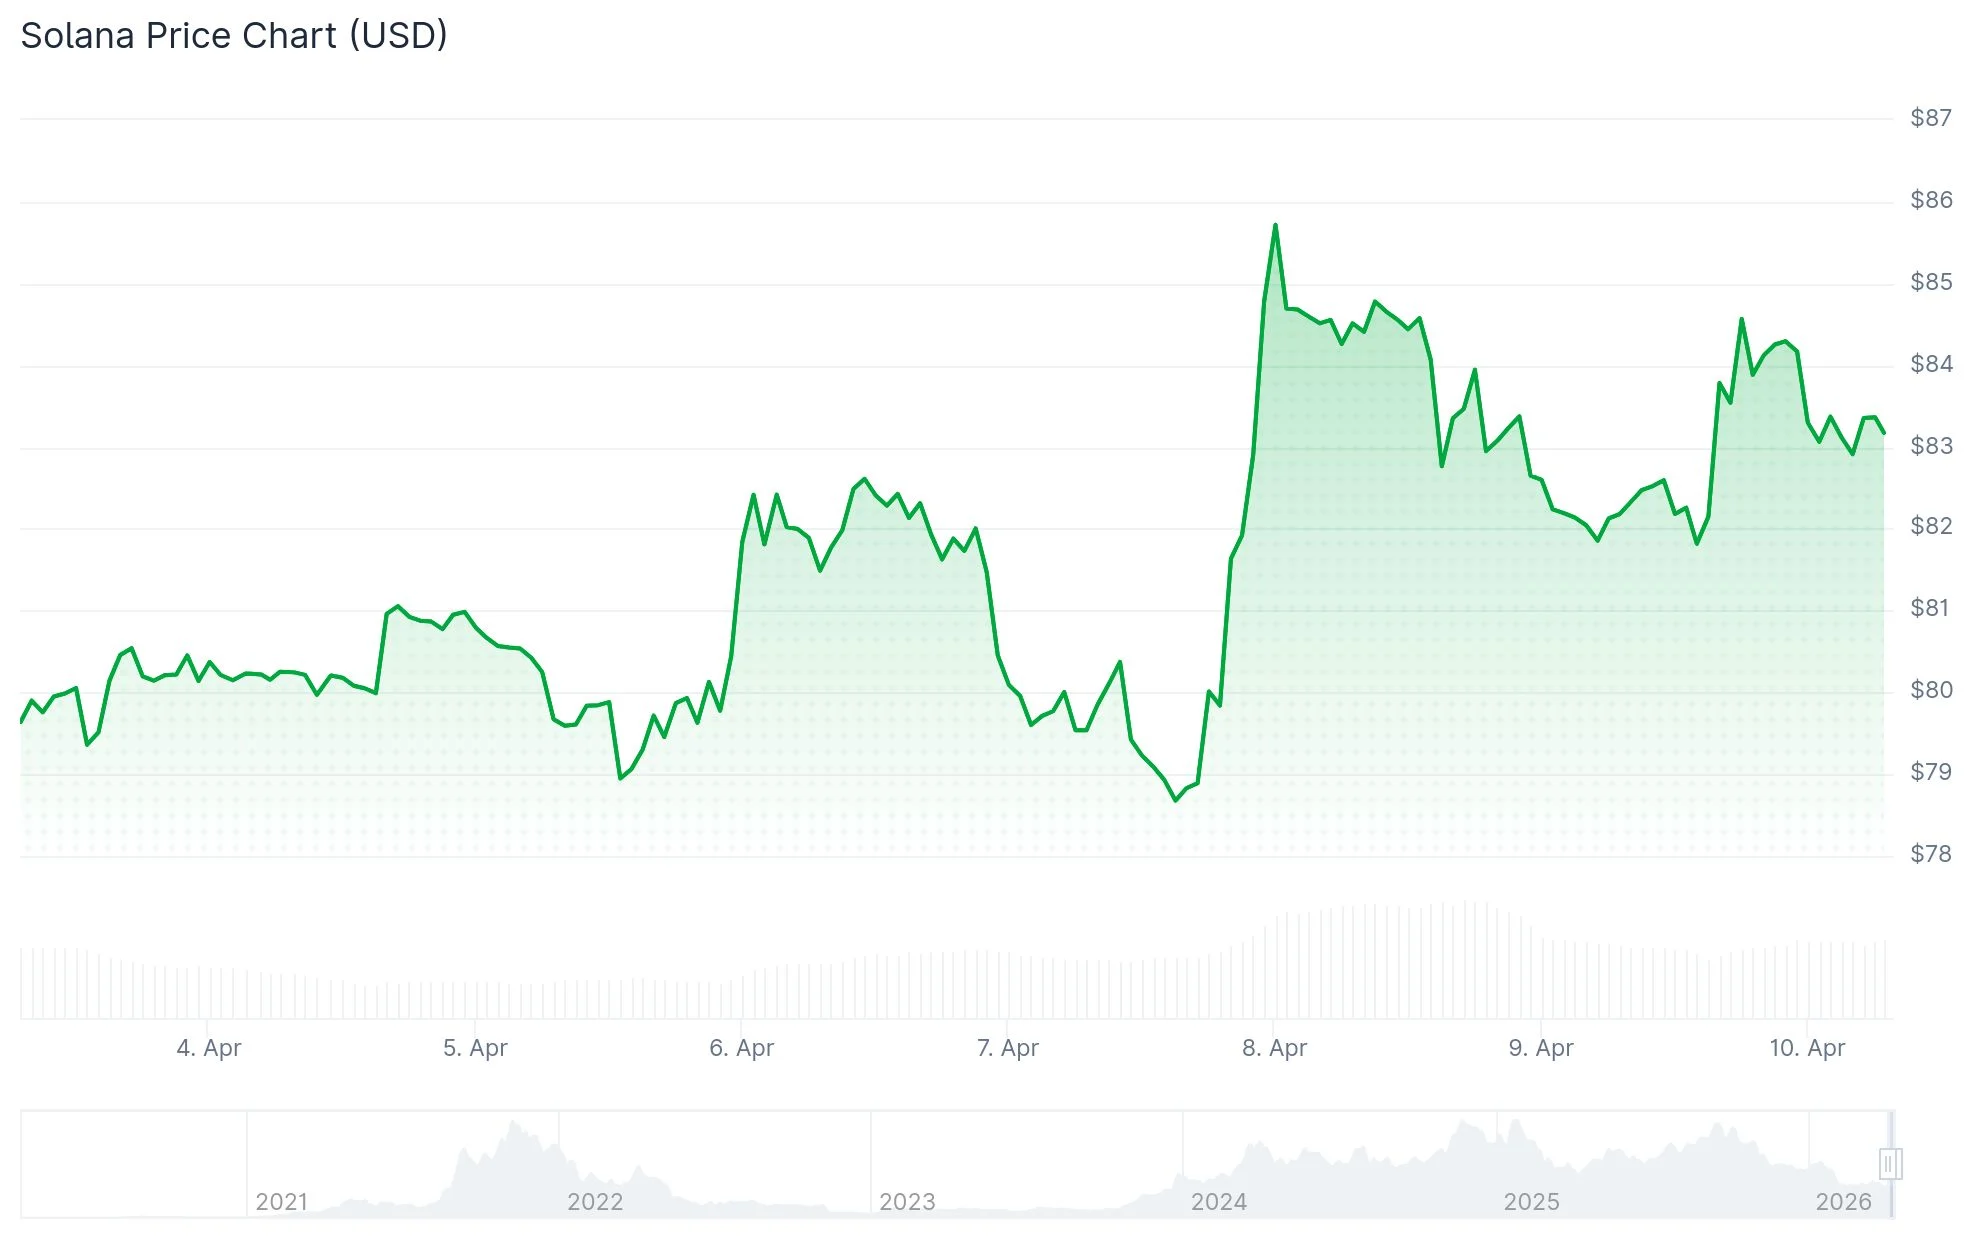
- Solana is currently positioned around $83, facing pressure from a downward trendline and multiple exponential moving averages
- ETF withdrawals totaled $17.08 million this week, with Tuesday recording an unprecedented single-day exit of $15.40 million
- Liquidation activity reached $7.99 million in the past day, with short positions accounting for the majority
- The crucial resistance barrier sits at the 50-day EMA zone between $87 and $88
- Technical analyst Ali Martinez identified a recurring pattern where SOL temporarily breaks above the 50-day MA before retreating
As of Friday, April 10, Solana maintains a position near $83, successfully defending the $80 floor but unable to generate upward momentum. The cryptocurrency remains constrained beneath its 50-day, 100-day, and 200-day Exponential Moving Averages, creating a neutral to bearish technical setup.
A declining trendline drawn from the peaks on January 14 and April 7 continues to cap upside movement, intersecting with the 50-day EMA in the $87–$88 range. Multiple attempts to breach this technical ceiling have failed to produce sustained closes above it.
Momentum indicators present a subdued picture. The Relative Strength Index currently registers 47, indicating neutral territory without directional conviction. Meanwhile, the Moving Average Convergence Divergence displays marginally positive values, though insufficient to signal an imminent trend reversal.
Institutional Capital Exits Accelerate
Institutional sentiment toward Solana has deteriorated noticeably throughout the week. United States-based spot SOL exchange-traded funds have experienced cumulative withdrawals of $17.08 million, headlined by Tuesday’s historic single-session outflow of $15.40 million.

Prolonged ETF redemptions generally signal institutional reallocation strategies and often contribute to downward price momentum in the underlying asset.
In derivatives markets, CoinGlass tracking reveals $7.99 million in liquidations across the last 24-hour period. Short positions comprised $5.97 million of these forced closures, indicating bears faced the brunt of volatility. Open Interest contracted by 1.48% to $4.78 billion, signaling diminished trader engagement.
The Open Interest-weighted funding rate maintains a marginal positive stance at 0.0038%, while the long-short ratio stands at 1.0141, indicating a slight tilt toward bullish positioning among active traders.
Technical Expert Identifies Cyclical Breakdown Behavior
Cryptocurrency analyst Ali Martinez shared observations on X documenting a pattern that has materialized three separate times since November 2025. In each instance, SOL momentarily recovered the 50-day Moving Average before failing to sustain elevation, followed by sideways movement and subsequent price deterioration.
Martinez emphasized that extended periods trading beneath the 50-day MA historically precede additional downside moves, based on recent price behavior.
Solana has predominantly oscillated within a $78–$92 corridor since March 5, when volatile trading drove prices from $92 down to $78 within a single session.
For bulls, a decisive daily close above $88 would establish a path toward the 100-day EMA positioned near $99.86. Conversely, if SOL breaks decisively below $80, attention shifts to support zones at $76.50 and potentially $47.90, a longer-term downside objective AMBCrypto outlined in February using weekly chart analysis.
Immediate resistance confronts SOL at $85, followed by the critical $88 level. Downside protection exists at $82.50, $81.40, and $80.

