
 Price: Exchange Balances Drop 10% As Market Eyes $206 Resistance Level")
TLDR
- SOL has rebounded from key support around $155, showing technical strength
- Whales and retail investors are both accumulating, indicating broad market confidence
- Solana’s Total Value Locked (TVL) has reached a 3-year high in native SOL terms
- ETF inflows have totaled $137.4 million since mid-July, showing institutional interest
- Technical indicators suggest a possible breakout to $206 and potentially $250 by September
Solana has begun to build significant momentum after successfully bouncing off a key support zone around $155. This price level represented a confluence of technical factors including an ascending trendline and the golden Fibonacci retracement range between 0.618 and 0.7, creating a strong foundation for a potential new upward move.
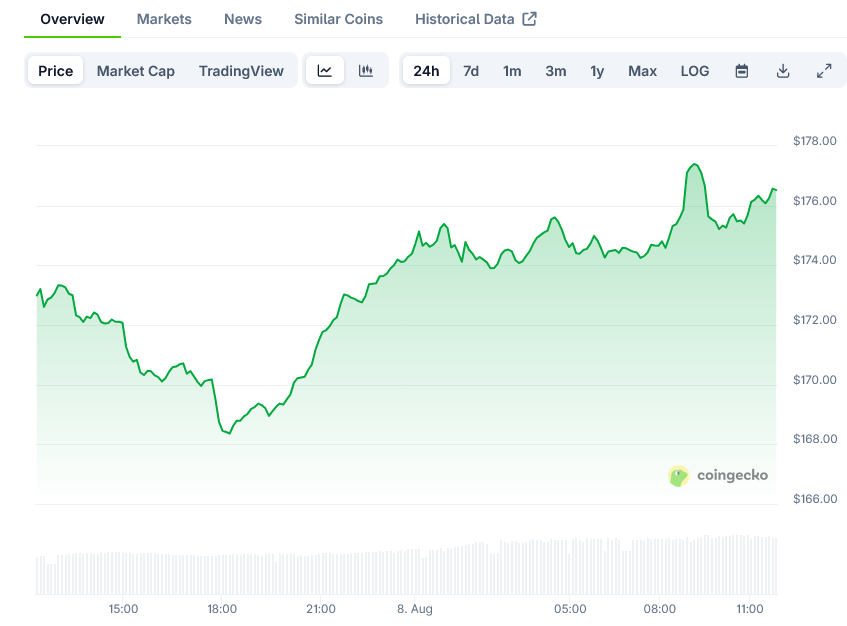
The recent price action shows SOL trading at approximately $167.99, up 2.50% in the last 24 hours. This upward movement comes after a 10% dip earlier in the week, which appears to have been a temporary correction rather than a longer-term reversal.
Technical indicators are aligning in favor of the bulls. The Stochastic RSI entered oversold territory during the recent dip, suggesting that Solana may have found a local bottom. This technical reset often precedes strong upward price movements in trending markets.
On the chart, SOL is now testing the upper resistance of a descending channel that has contained price action in recent days. Decreasing sell volume during these tests indicates weakening bearish pressure, which could soon lead to a breakout.
Institutional and Retail Support
The bullish case for Solana extends beyond just technical indicators. On-chain data reveals a compelling story of accumulation by both major players and smaller investors.
Solana ETFs have attracted approximately $137.4 million in net inflows since mid-July. While these inflows haven’t been as consistent as those seen with Bitcoin or Ethereum ETFs, they demonstrate growing institutional confidence in SOL as a viable investment.
July 24th saw a notable spike of $13.4 million flowing into Solana ETFs, highlighting periods of intense institutional interest. This pattern of accumulation resembles the early stages of institutional adoption seen in more mature crypto assets.
Exchange balances for SOL have dropped by 10%, suggesting that fewer coins are available for immediate sale. This reduction in potential sell pressure often supports price stability and can precede upward movements.
On-Chain Growth and Development
Perhaps the most telling bullish indicator comes from Solana’s ecosystem metrics. According to DeFiLlama, Solana’s Total Value Locked (TVL) measured in native SOL terms has reached its highest point in over three years.
This week Solana reached its highest TVL in terms of SOL in over 3 years.
When looking at TVL on DefiLlama, it's often useful to look both in terms of USD and a chain's native token. pic.twitter.com/84xM70UEbX
— DefiLlama.com (@DefiLlama) August 5, 2025
This metric is particularly important because it’s not just reflecting dollar-denominated growth but actual utilization of the network. More SOL tokens are being deployed across DeFi protocols than at any point since the previous market cycle peak.
The rising TVL demonstrates increasing user commitment and activity on the Solana blockchain. This fundamental strength provides a solid foundation for price appreciation beyond speculative interest.
CryptoQuant’s data shows that whale addresses have been quietly placing orders at current trading prices. This accumulation by large holders often precedes major price movements.
At the same time, buyer volume among retail traders, particularly those with positions under $1 million, has surged. This broad-based accumulation across different investor classes strengthens the case for a continued bull run.
Price Targets and Resistance Levels
The next major hurdle for Solana appears to be the recent local high of $206, a level where sellers previously overwhelmed buyers. Breaking through this resistance could open the path to further gains.
Some analysts using Elliott Wave theory suggest even higher targets, with Fibonacci extension projections pointing to $214 and potentially $250 by late August or early September.
For the shorter term, reclaiming and holding above $176 would be a key confirmation of renewed bullish momentum. On the downside, the $155 support level remains crucial to watch.
The golden crossover beginning to form on the daily chart adds another classic bullish momentum signal to the mix. This technical pattern occurs when shorter-term moving averages cross above longer-term ones.
Solana’s recent price action, combined with strong fundamentals and technical indicators, suggests that SOL may be preparing for its next significant move upward as we head into the fall months.

