
 Price Surges 7% as Traders Eye Critical $100 Breakout Level")
TLDR
- Solana experienced a 7%+ rally within 24 hours, touching $97.67 while the overall crypto market gained approximately 3.6%.
- The network’s total value locked increased by 25% throughout the past 30 days, demonstrating renewed investor confidence.
- SOL maintains trading above the $92 mark and its 100-hour simple moving average, with bullish support establishing at $94.
- Critical resistance points are positioned at $98 and $100, while downside support exists at $92 and $88.
- The token has appreciated over 40% since hitting its February bottom, as the RSI indicator advances toward 60 from previously oversold territory.
Solana has delivered an impressive 24-hour performance, rallying more than 7% to peak at $97.67 before experiencing a modest retracement to settle around the $95 zone. This upward movement coincides with a broader cryptocurrency market recovery that saw gains of approximately 3.6% during the identical timeframe.
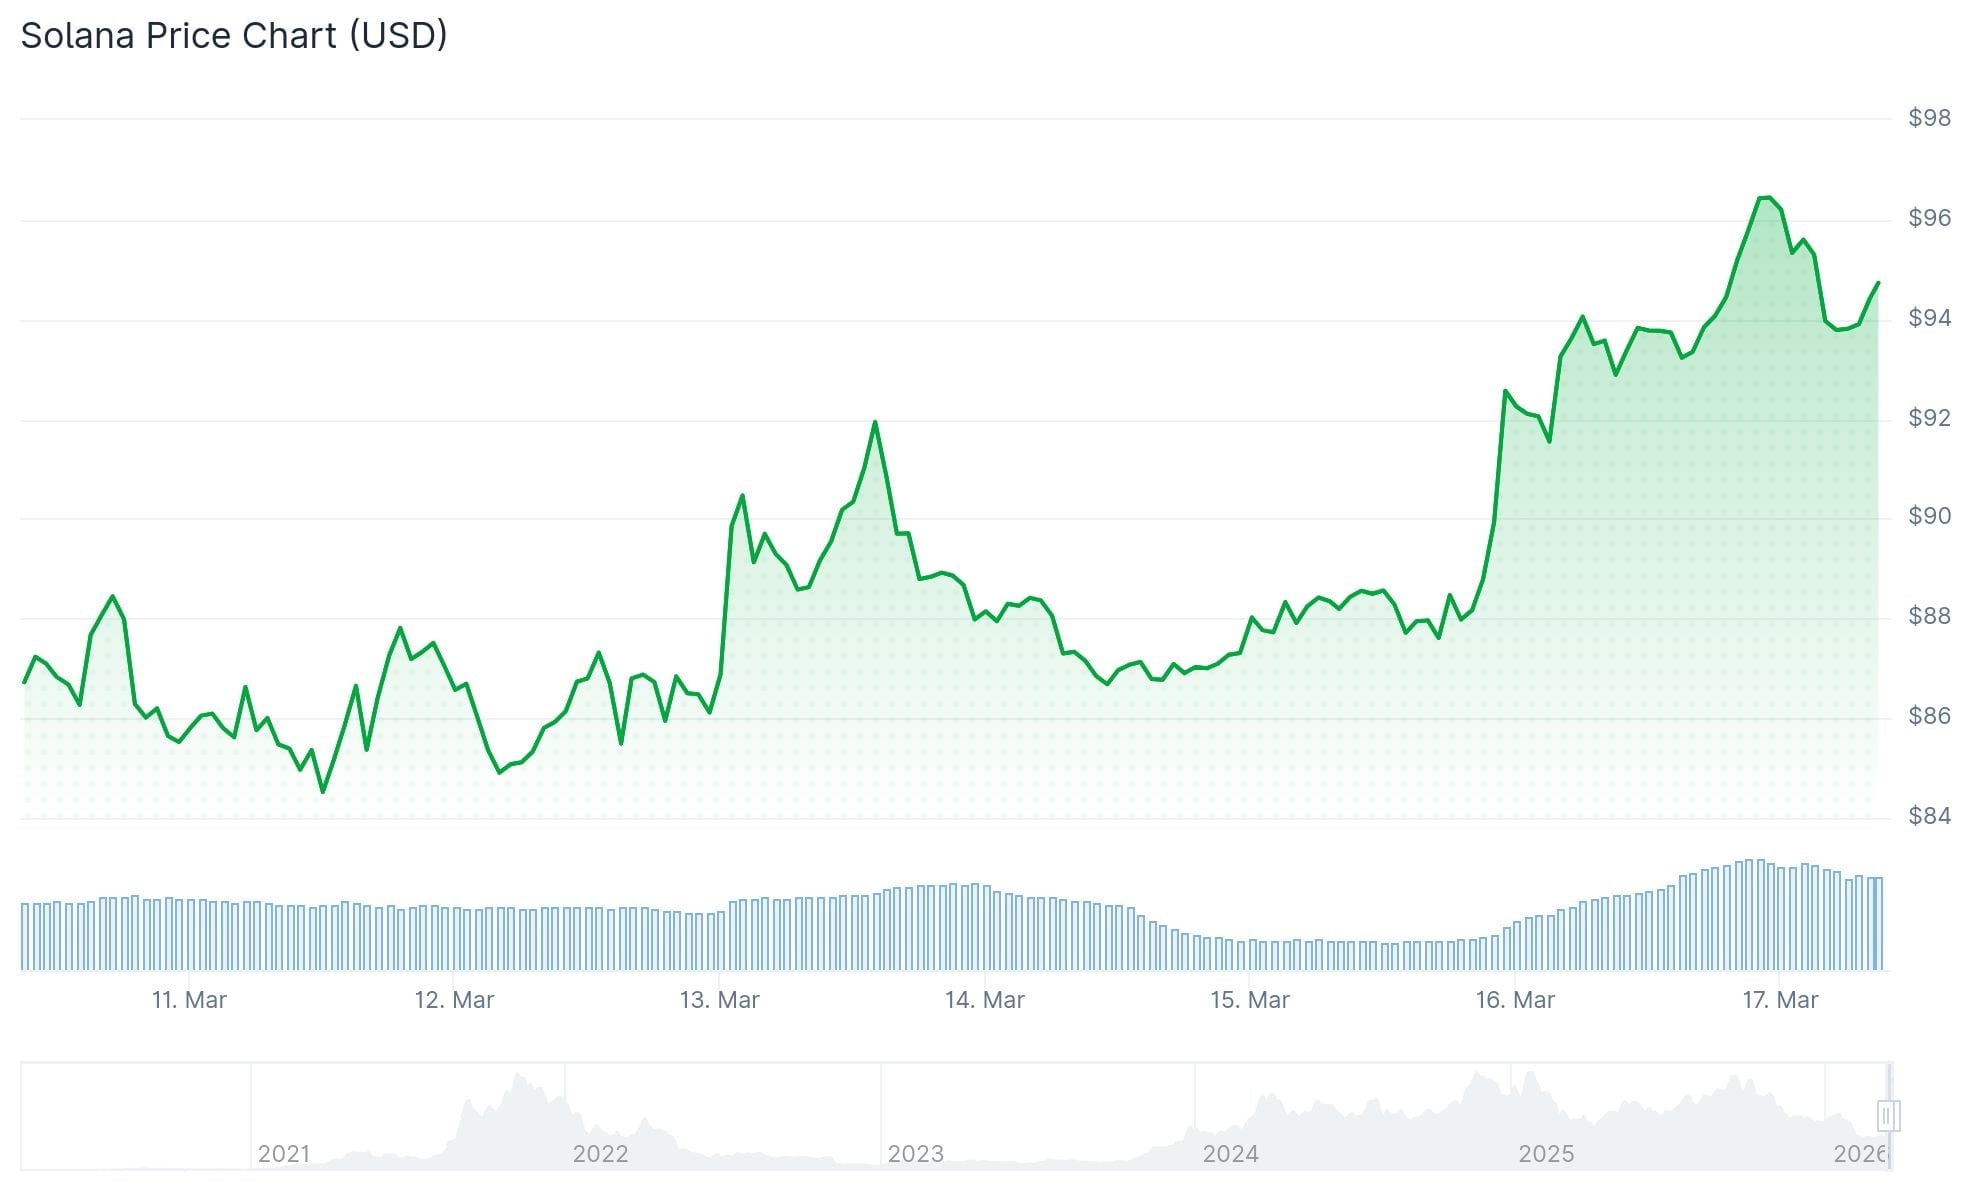
Currently, SOL maintains its position above the $92 threshold and trades above its 100-hour simple moving average. Technical analysis reveals a bullish trend line forming with critical support established at $94 on the hourly timeframe, according to data sourced from Kraken.
Critical Resistance Zones Emerge
The cryptocurrency now encounters resistance around the $95 level, with the subsequent barrier positioned at $98. The psychologically significant $100 threshold represents the primary challenge ahead. Successfully breaking and closing above $100 could pave the way toward $105, with potential extension to $112.
Conversely, should SOL fail to maintain support above $92, the next cushion sits at $88. Breaking beneath $88 would likely bring the $82 level into play.
While the recent upswing correlates with broader market stabilization, Solana has notably outpaced the majority of alternative top-10 cryptocurrencies during this same period.
On-Chain Metrics Validate Price Action
The total value locked within Solana’s ecosystem expanded by 25% over the preceding 30-day period. This metric, which quantifies the amount of capital deployed within a blockchain’s infrastructure, indicates accelerating platform utilization when showing this magnitude of growth.
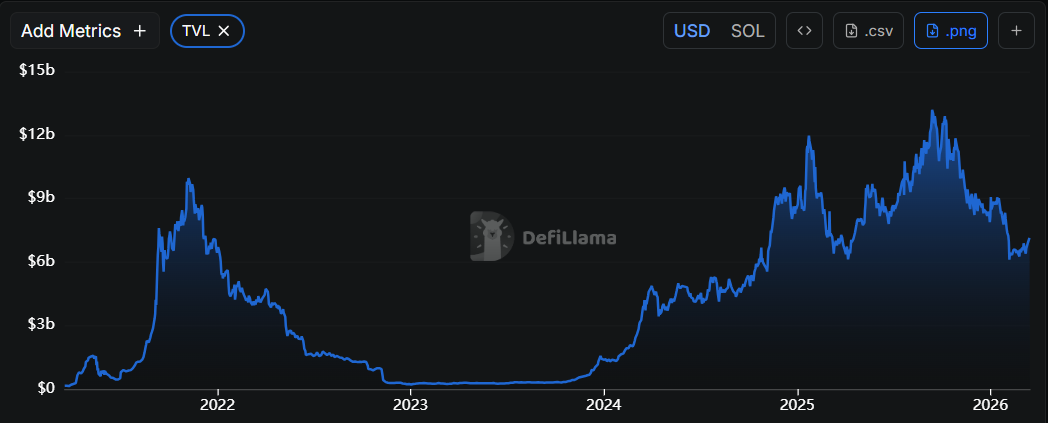
Continuous developer engagement and consistent decentralized application deployments across the network have persisted. These fundamental on-chain indicators have contributed to supporting the current bullish price trajectory.
Solana has appreciated more than 40% from its February trough. The Relative Strength Index has recovered toward the 60 threshold after rebounding from oversold conditions experienced earlier this year.
Price action has been oscillating within a range bounded by $80 support and $95 resistance throughout recent weeks, creating a consolidation formation that market participants frequently monitor for potential breakout opportunities.
The 200-day moving average continues to reside above present price levels, suggesting the long-term directional bias hasn’t completely reversed yet.
SOL is currently valued at approximately $94.62, commanding a market capitalization near $54 billion, with a 52-week trading range spanning from $70.61 to $252.78.

