
 Price: Technical Patterns Show Accumulation Phase as $1 Billion Flows In")
TLDR
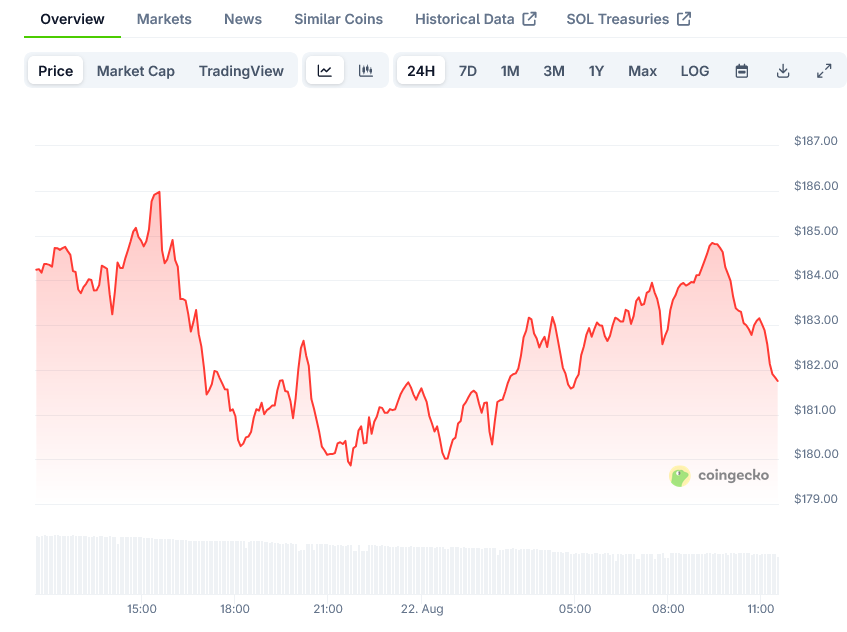
- Solana price currently at $184, holding higher lows while testing major resistance
- Over $1 billion in capital flowed into Solana network in the past 30 days
- Technical charts show ascending triangle and falling wedge patterns suggesting accumulation
- Solana accounted for 42% of recent bridging activity, surpassing Ethereum
- Large whale unstaked nearly 100,000 SOL ($18 million) and transferred to Binance
Solana is showing signs of strength in August 2025 as it tests key resistance levels while maintaining higher lows on its chart. The cryptocurrency is currently trading around $184, representing a 3.55% increase in the last 24 hours.
Despite this recent uptick, SOL has faced some short-term pressure, dropping 6.7% over the past week and 6.27% over the last month. The all-time high for Solana stands near $294.
On-chain data reveals a surge in liquidity, with more than $1 billion in capital moving into the Solana network during the past month. This influx of funds has created stronger liquidity conditions for the token.
The technical structure of Solana’s price action resembles an accumulation base. This pattern consists of two extended consolidation zones that form a foundation after a prolonged decline.
Solana’s recent exit from a descending channel points to a structural change in market behavior. Analysts note this shift typically occurs when selling pressure weakens and demand begins to return to the market.
The pattern bears similarities to the Wyckoff accumulation model, where sideways price ranges precede a breakout. Solana’s ability to establish higher lows, coupled with increasing volume near support levels, strengthens the case for upward continuation.
Based on this model, if buying momentum extends, Solana could push toward the $200 mark. Market watchers suggest that a sustained breakout might propel the price toward $240 or $260, provided the accumulation structure remains intact.
Capital Flows Support Bullish Outlook
Cross-chain activity data confirms growing demand on Solana. The network has attracted over $1 billion in bridged funds during the past 30 days, outpacing flows into Ethereum, Arbitrum, and Base.
This trend suggests Solana is becoming an important venue for liquidity beyond just memecoin speculation. On-chain metrics show Solana accounting for 42% of bridging activity in recent weeks, with Ethereum trailing behind during the same period.
Technical strategist Anup has identified an ascending triangle pattern on Solana’s weekly chart. This formation has developed as price repeatedly tests resistance between $250 and $260 while maintaining an upward trendline.
The $SOL chart is pure poetry.
Perfect bounce from the uptrend support, higher lows confirmed.
No need to overthink. Targeting the range highs at $295. pic.twitter.com/PrLu4R1CXm
— Crypto King (@CryptoKing4Ever) August 19, 2025
When combined with higher lows, this pattern often signals upward continuation. A confirmed close above $260 would validate the triangle breakout and potentially clear the path toward $320 or even $350. Until such confirmation occurs, the ranging price action suggests volatility compression ahead of a potential move.
On shorter timeframes, a falling wedge pattern has formed on the four-hour chart. This wedge narrowed as Solana tested the $176 level before rebounding.
Whale Activity Introduces Caution
On-chain tracking has revealed a large transaction that warrants attention. A whale unstaked nearly 100,000 SOL, valued at approximately $18 million, and transferred the tokens to Binance.
Such large exchange transfers often indicate potential selling or hedging activity. While this move does not invalidate the accumulation or triangle structures, it does introduce some short-term risk.
If this whale activity leads to selling pressure, the support zone between $176 and $169 will be crucial to maintain. This range has served as a defensive level for Solana in recent weeks.
Solana’s current technical position leans positive. The combination of accumulation bases, rising inflows, and an ascending triangle suggests potential for a breakout above resistance.
A move beyond $260 could open space toward $320 to $350 if accompanied by strong volume. Short-term wedge structures also support a bullish scenario.
However, whale transfers to exchanges remind traders that near-term volatility remains possible. If Solana holds support between $169 and $176, the broader bullish structure will remain valid.
At the time of writing, Solana stands at a critical juncture. Confirmation above resistance will determine whether the next leg higher can develop, potentially pushing the cryptocurrency toward the $200 mark and beyond.
Solana’s transaction speed has reached new highs, with true transactions per second (TPS) surpassing 2,300 for the first time. This milestone demonstrates the network’s progress and ability to handle increased demand.
Solana’s price is currently forming a range between the $175-$180 support base and the $295 resistance zone, with analysts pointing to the latter as a potential target if the bullish structure holds.

