
 Price: Weekly Gains of 7% as SOL Trades Above $210 Support Level")
TLDR
- Solana has broken through the $212 resistance level and is trading above $210
- SOL is up 7% on the week, showing continued bullish momentum
- Technical indicators suggest potential for a major breakout with targets as high as $1,000
- TradFi integration and possible ETF approval in October could drive demand
- Price movement shows strength with support forming at the $208-$212 range
Solana has been making waves in the crypto market with a fresh surge above the $212 resistance level. The cryptocurrency has gained momentum in recent weeks, showing a 7% increase over the past week alone. This upward trajectory has placed SOL in a strong position as it continues to consolidate above the $210 mark.
The movement comes as part of a broader pattern that has been forming since the mid-April market bottom. Analysts are watching closely as SOL appears to be on the verge of escaping a rising wedge pattern, which could signal a significant price movement in the near future.
Trading data shows that SOL is now trading comfortably above both the $210 level and the 100-hourly simple moving average. This technical position reinforces the bullish sentiment surrounding the cryptocurrency.
A bullish trend line has formed with support at $212 on the hourly chart, providing a foundation for further gains. The immediate resistance level to watch is at $218, followed by $220, with a major milestone at $232.
Market observers note that if SOL can successfully close above the $232 resistance zone, it could set the stage for another steady increase. The next key resistance level would then be $244, potentially opening the door for a push toward the $250 mark.
Technical Indicators Point Upward
The technical outlook for Solana is increasingly positive. The Relative Strength Index (RSI) has bounced firmly into positive territory at 60, confirming that buyers are driving the current market movement.
The MACD for SOL/USD is gaining pace in the bullish zone, potentially forming a golden cross that would confirm a longer-term bullish trend. This indicator has been hovering indecisively above and below the signal line over the past week but appears to be strengthening.
Momentum indicators suggest that a confirmed breakout could propel Solana to retest its early-year all-time high near $300. If this level is reclaimed as support, it could open the door for new price discovery with little historical resistance to limit upside.
The next major milestone would be the $500 level, representing a potential 135% gain from current prices. As the bull cycle matures, some analysts speculate that SOL could extend as high as $1,000, which would mark a 360% surge from current levels.
Just 32 days left until the SEC’s final deadline on #Solana $SOL Spot ETF applications.
Ruling date: October 10th. pic.twitter.com/HzJfpcLXSX
— CryptoPotato Official (@Crypto_Potato) September 8, 2025
TradFi Integration Driving Demand
Solana has positioned itself at the forefront of this market cycle, which has been notably driven by traditional finance (TradFi) players. The cryptocurrency has gained inclusion in corporate treasuries, serving as a vehicle for both institutions and public markets to gain SOL exposure.
The coming month could see even deeper TradFi integration, with spot ETF issuers facing their final SEC decision deadline in October. This potential approval represents a major catalyst for Solana’s price.
Adding to the positive outlook is the U.S. CLARITY Act, which stands to unlock sidelined capital from institutions that have been waiting for regulatory clarity. This legislative development could accelerate demand in the coming weeks.
Solana’s ecosystem has historically sparked surges in the broader market, particularly in the meme coin sector. The platform coined the term “meme coin mania,” and a strong performance from SOL could reignite similar trends across the market.
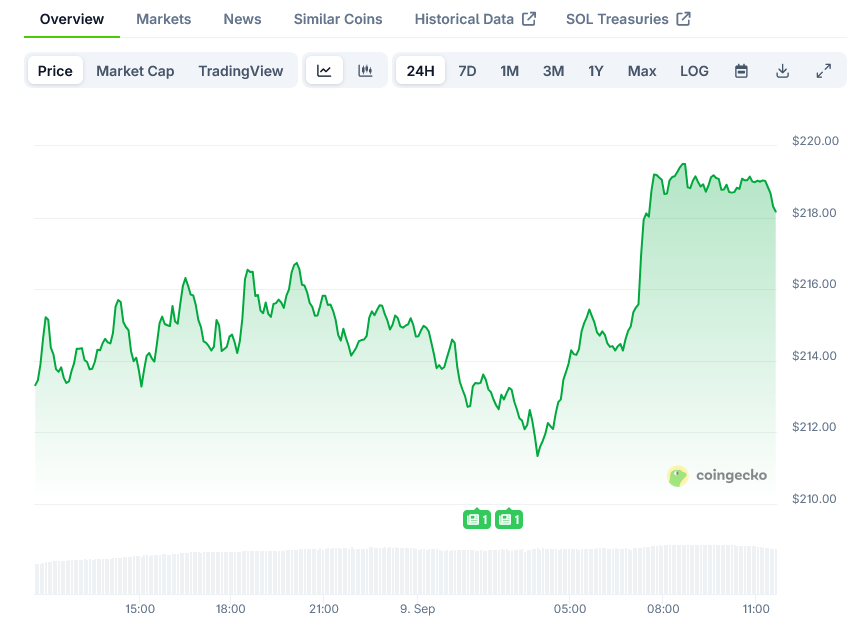
For investors watching the downside, initial support can be found near the $212 zone. The first major support level is around $208, corresponding to the 50% Fibonacci retracement level of the recent upward move from the $199 swing low to the $217 high.
A break below the $208 level might send the price toward the $204 support zone. If there is a close below the $204 support, the price could decline toward the $200 support in the near term.
Today’s price action shows SOL continuing to consolidate above $210, with bulls eyeing the $218 resistance level as the next target to overcome.

