
 Price: SEC Reviews Canary Capital ETF Proposal Following 53% Weekly Surge")
TLDR
- SUI surged 53% to $3.62 following SEC’s review of Canary Capital’s proposed spot SUI ETF
- Technical indicators show mixed signals with RSI at neutral 52.91 after cooling from overbought conditions
- Exchange outflows of $8.74 million suggest accumulation despite bearish sentiment metrics
- Key resistance at $4.25 with support levels at $2.80 and $2.29
- Liquidation clusters between $3.80-$4.00 pose near-term resistance challenges.
Sui token experienced a dramatic price surge this week. The cryptocurrency jumped 53% after news broke that the Securities and Exchange Commission began reviewing Canary Capital’s application for a spot SUI exchange-traded fund.
The SEC initiated its formal review process on July 23, 2025. This development marks a major milestone for the Sui blockchain project.
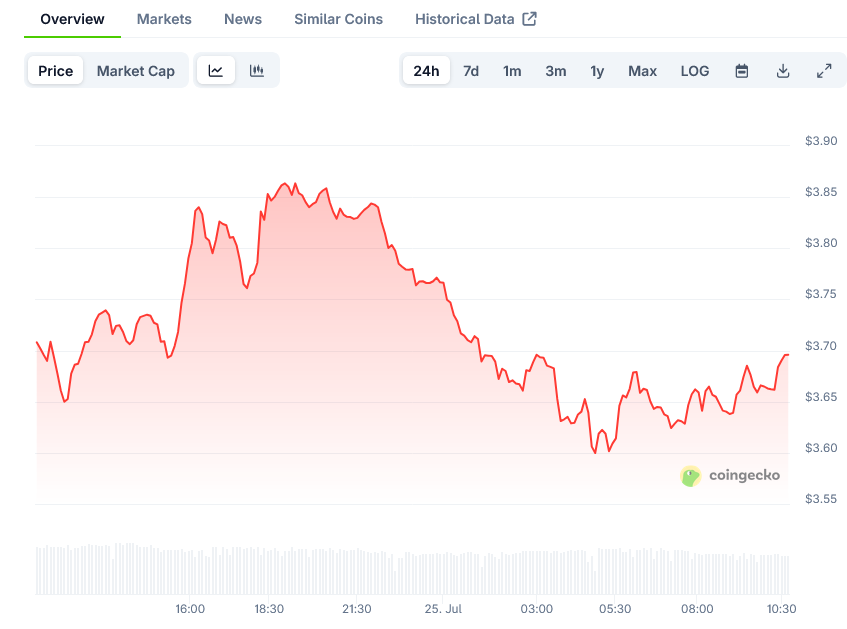
SUI currently trades at $3.62, down 3.77% in the past 24 hours. The pullback follows the token’s rapid climb from around $2.30 earlier this week.
Market analysts view the SEC’s engagement as validation of Sui’s position as a legitimate Layer-1 blockchain. The regulatory review signals growing comfort with alternative blockchain assets beyond Bitcoin and Ethereum.
Technical analysts had noted on July 22 that SUI short positions suggested a potential move above $4. This contrarian indicator combined with the ETF news created ideal conditions for the price explosion.
Technical Analysis Shows Consolidation
The Relative Strength Index for SUI sits at 52.91. This neutral reading indicates the token has cooled off from severely overbought conditions during the rally.
The MACD histogram displays -0.0237, showing bearish momentum in the short term. Profit-taking activities are contributing to this temporary downward pressure.
However, the overall MACD remains positive at 0.1952. This suggests the broader uptrend stays intact despite current consolidation phases.
Sui’s position within Bollinger Bands provides additional context. The token trades at 0.5117 of the band width, indicating neither extreme fear nor greed.
Exchange data reveals interesting dynamics. Spot exchanges recorded net outflows of $8.74 million, reflecting reduced selling pressure.
These outflows suggest investors are moving tokens to self-custody. This behavior typically aligns with accumulation trends and bullish outlooks.
Market Sentiment Diverges from Price Action
Despite the technical breakout, sentiment metrics paint a different picture. Weighted Sentiment dropped to -0.934 while social dominance fell to 0.011%.
This disconnect between price action and sentiment could serve as a contrarian signal. Major rallies often begin during periods of low confidence when backed by solid technical foundations.
Spot Taker CVD data shows ongoing dominance by market sellers. Strong taker sell activity persists despite the recent bullish price movement.
The presence of aggressive sellers amid rising prices may indicate a transition phase. High demand appears to be absorbing the selling pressure.
Binance’s liquidation heatmap reveals dense clusters between $3.80 and $4.00. Over $3 million in long liquidations occurred in this zone, creating potential resistance.
SUI faces immediate resistance at $4.25 based on Binance spot market data. Breaking this level could trigger movement toward the 52-week high of $5.29.
Support levels appear well-defined on the downside. Immediate support sits at $2.80, offering a 22% buffer from current levels.
The pivot point at $3.67 serves as a crucial level for swing traders. Trading above this level maintains bullish bias while a break below signals deeper retracement.
Strong support at $2.29 represents a critical floor. This level coincides with major Fibonacci retracement levels from the recent rally.
Trading volume reached $256,410,177 on Binance spot markets. This healthy liquidity reduces execution risk for larger positions.
The ETF review process could take several months. This timeline creates potential volatility in both directions as traders position themselves.
SUI has broken out of a multi-month symmetrical triangle pattern. Fibonacci extension levels suggest further upside with the 1.618 level aligning near $7.
The breakout pattern depends on continued momentum and supportive fundamentals. Premature loss of buying pressure could reduce probability of reaching higher targets.
Current price action shows SUI consolidating recent gains while the market digests ETF news. Technical indicators display mixed signals with neutral RSI and bearish short-term momentum, but the fundamental catalyst of potential institutional access through an ETF provides underlying support.

