

Quick Overview
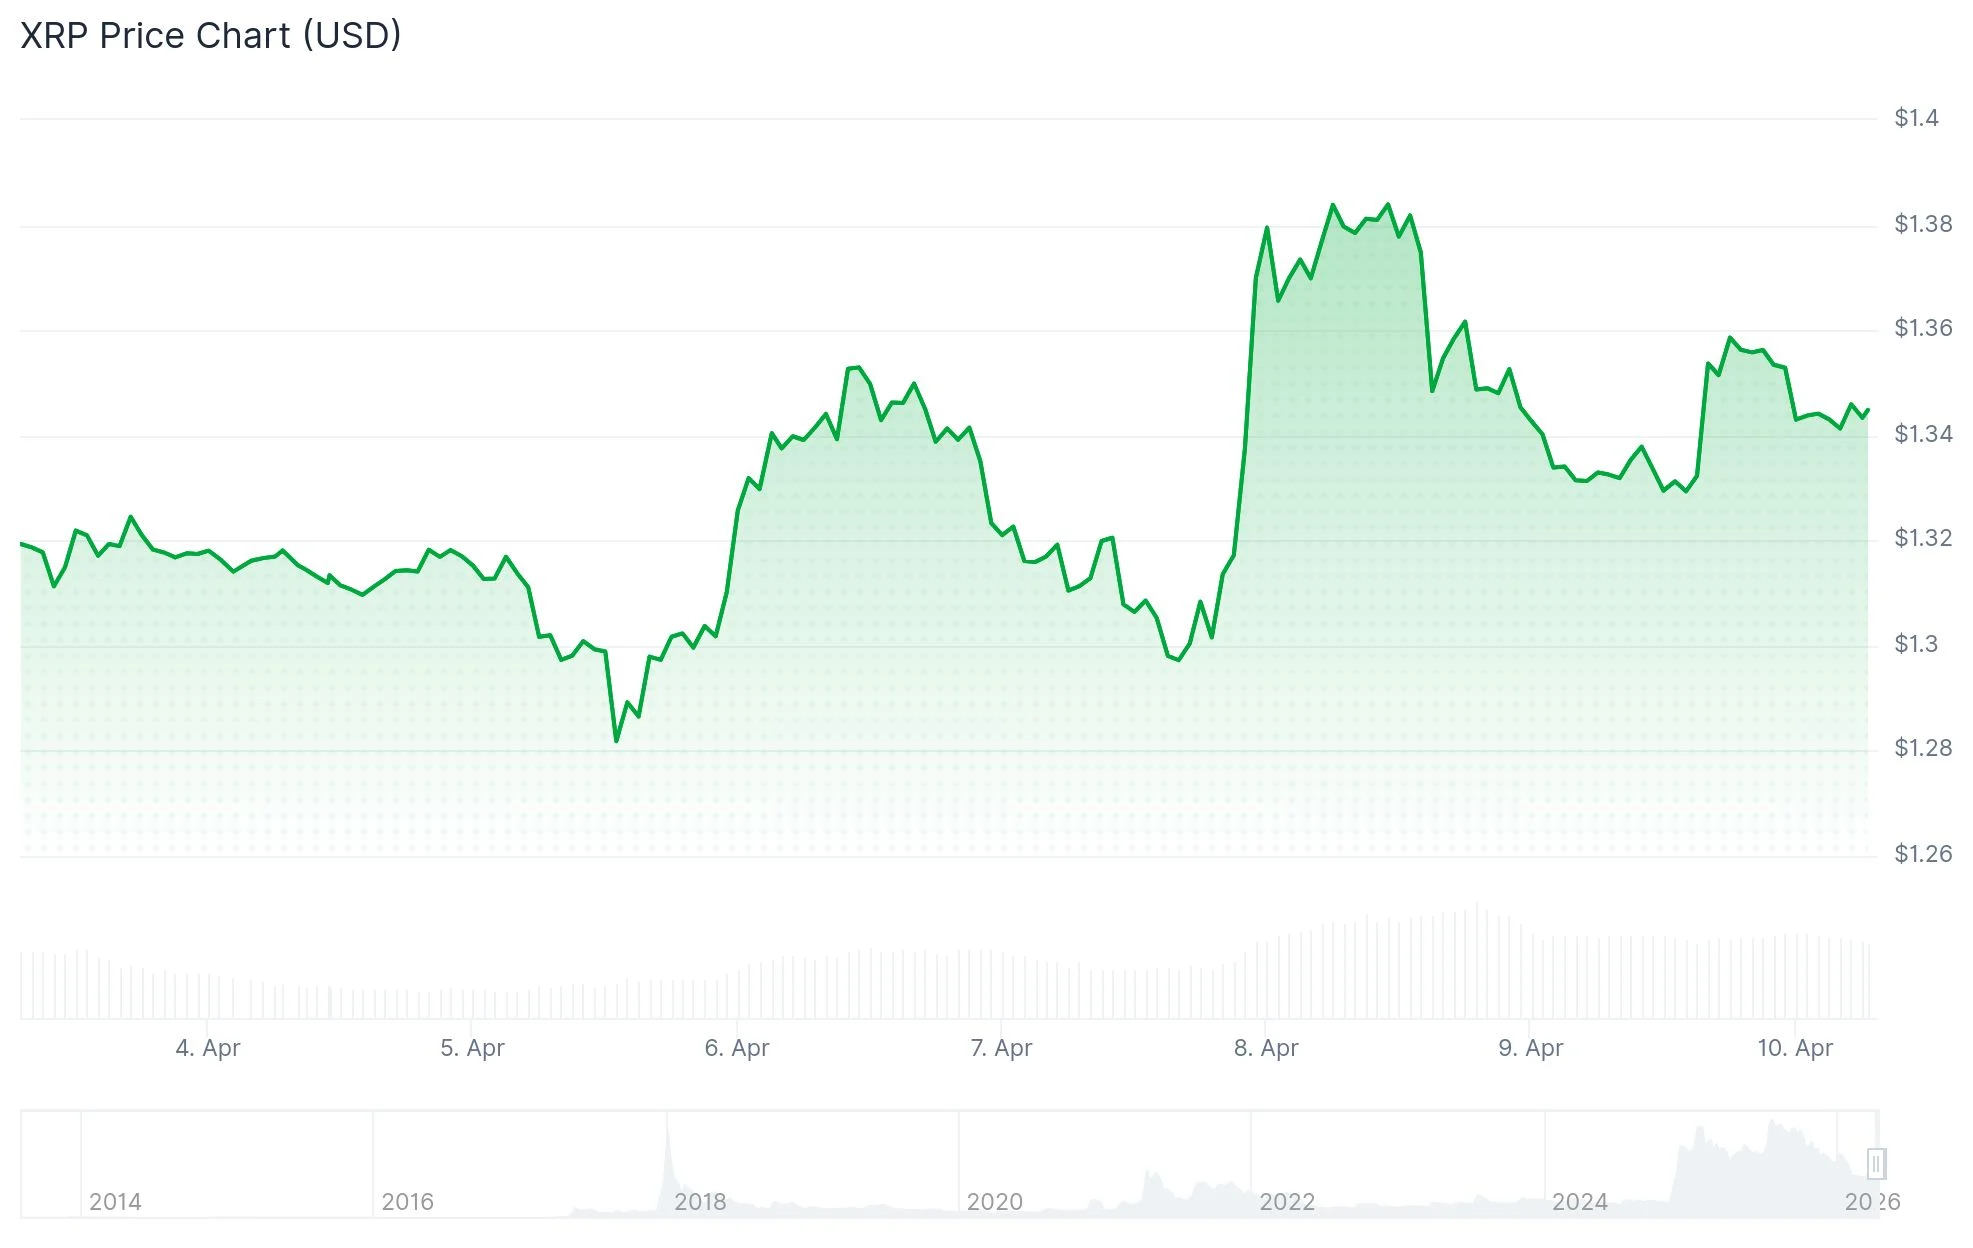
- XRP surged from $1.33 to $1.35 with elevated trading volume but encountered rejection at the $1.36 threshold
- Exchange-traded fund products recorded $3.32 million in net inflows, insufficient to catalyze significant upward movement
- Critical resistance zone spans $1.36–$1.40; a decisive breakout required for sustained bullish momentum
- Crucial support zones include $1.34 as immediate floor, followed by $1.31–$1.32 if selling intensifies
- Tentative US-Iran diplomatic agreement boosted overall market risk sentiment, providing tailwinds for digital assets
XRP currently hovers near $1.35 following a vigorous bounce from support zones around $1.32. This upward thrust occurred alongside substantial trading volume, successfully lifting the digital asset beyond the $1.34 threshold. Nevertheless, momentum stalled as price action consolidated in a narrow band beneath $1.36, lacking decisive upward continuation.
This recovery aligns with stabilization across the broader cryptocurrency landscape, where Bitcoin advanced 0.8% to $72,271 while the aggregate digital asset market capitalization climbed 1.4% to $2.52 trillion. The widely-tracked fear and greed indicator persists at 14, firmly entrenched in “Extreme Fear” zone.
XRP-focused exchange-traded products attracted $3.32 million in capital during this timeframe. However, this figure represents a relatively minor sum considering XRP’s overall market size. Market observers suggest the rebound stems primarily from technical chart patterns rather than substantive fundamental developments.
Critical Price Thresholds Under Observation
Examining the hourly timeframe, XRP maintains positioning above its 100-period Simple Moving Average and successfully cleared the 38.2% Fibonacci retracement level calculated from the recent decline spanning $1.3963 down to $1.3222. A descending trendline presents overhead resistance positioned at $1.3550.
The primary resistance barrier emerges at $1.36. A confirmed close surpassing this level would establish a pathway toward $1.368, coinciding with the 61.8% Fibonacci retracement measurement. Additional overhead targets include $1.38 followed by $1.40.
Regarding downside vulnerability, $1.34 now functions as the critical near-term pivot point. A breakdown beneath $1.31–$1.32 would invalidate the bullish reversal attempt. Further deterioration could expose $1.28 and subsequently $1.265 as potential landing zones.
Macro Political Developments
A precarious diplomatic agreement between the United States and Iran, facilitated through Pakistani mediation on April 7, contributed to stabilizing risk-oriented assets. The arrangement mandated Iran reopen the strategically vital Strait of Hormuz, the maritime corridor responsible for approximately 20% of worldwide petroleum transportation. Commercial oil tanker traffic through the strait has not yet returned to normal operational levels.
Former President Trump announced on April 9 that American military personnel would maintain regional presence until Iran demonstrates complete adherence to ceasefire terms. Equity markets posted gains for the second straight session, with both the Nasdaq and Dow Jones advancing 0.73%. Cryptocurrency markets found stability parallel to traditional equities as investor risk tolerance marginally improved.
According to current market data, XRP maintains its position at $1.35, with the $1.36 resistance barrier remaining unbreached.

