TLDR
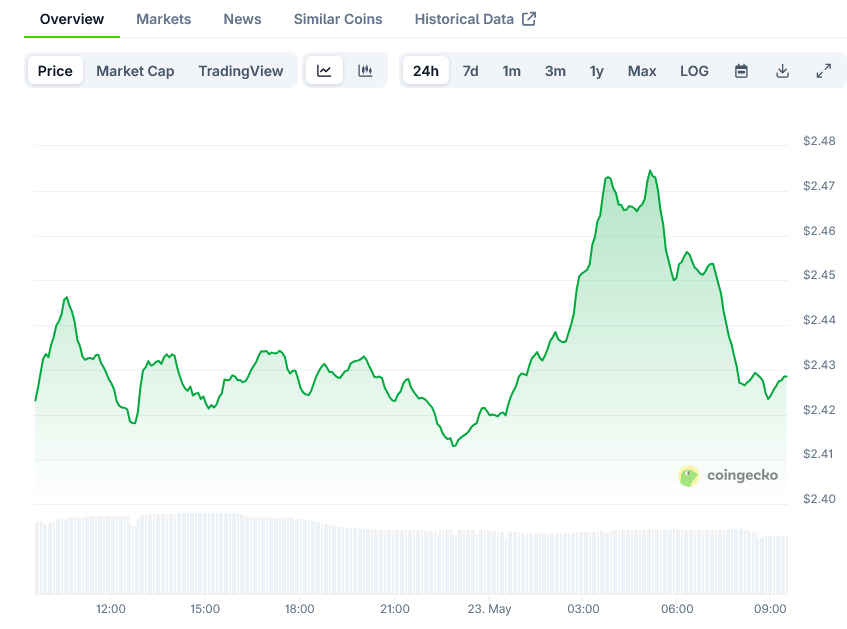
- XRP price consolidated above $2.40 and broke through a rising channel resistance at $2.450
- The cryptocurrency is currently trading above $2.40 and the 100-hourly moving average
- Bulls are targeting the $2.50 resistance level with potential moves toward $2.65-$2.75
- Technical indicators show bullish momentum with MACD gaining pace and RSI above 50
- Support levels sit at $2.45 and $2.40 if the current upward trend reverses
XRP price has entered a consolidation phase above the $2.40 zone. The cryptocurrency is now showing upward movement and could target a breakout above $2.50.
The digital asset started a recovery above the $2.40 support level. This move followed similar patterns in Bitcoin and Ethereum markets.
XRP pushed through the $2.35 and $2.365 resistance levels during its recent climb. The price also cleared the $2.40 resistance zone.
A key development occurred when XRP broke above a rising channel. This channel had resistance positioned at $2.450 on the hourly chart.
Bulls drove the price toward the $2.50 level during this move. The cryptocurrency reached a high of $2.4796 before entering its current consolidation phase.

XRP is now trading above the $2.40 level. The price also remains above the 100-hourly Simple Moving Average.
The cryptocurrency is consolidating above the 23.6% Fibonacci retracement level. This level comes from the upward move between $2.3360 and $2.4796.
Resistance Levels and Price Targets
The price faces immediate resistance near the $2.480 level. The first major resistance sits at the $2.50 zone.
Beyond $2.50, the next resistance level is positioned at $2.550. A clear break above this level could send XRP toward $2.650.
Further gains might push the price to the $2.720 resistance. The cryptocurrency could even reach $2.750 in the near term.
The next major challenge for bulls would be the $2.80 level. This represents a key psychological resistance zone.
Support Structure and Downside Risks
If XRP fails to clear the $2.50 resistance, a decline could follow. Initial support on the downside sits near $2.450.
The next major support level is at $2.40. This coincides with the 50% Fibonacci retracement level of the recent upward move.
A break below $2.40 could lead to further declines. The price might then test the $2.350 support level.
The next major support zone sits near $2.3250. This level could provide strong buying interest if reached.
Technical indicators are showing bullish momentum. The hourly MACD is gaining pace in the bullish zone.
The RSI indicator is trading above the 50 level. This suggests continued upward momentum in the near term.
Major support levels are positioned at $2.450 and $2.420. Key resistance levels sit at $2.480 and $2.50.


