
 Price: Recovery Attempts Stall at $3.06 Resistance Level")
TLDR
- XRP price dropped over 7% in a 15-minute window on August 14, contributing to $420 million in crypto liquidations
- Price recovered quickly after the sudden plunge, holding key support at $3.00
- A bearish trend line is forming with resistance at $3.06 on the hourly chart
- The bullish structure remains intact as long as price stays above $2.76
- Technical indicators show MACD gaining pace in the bearish zone and RSI below 50
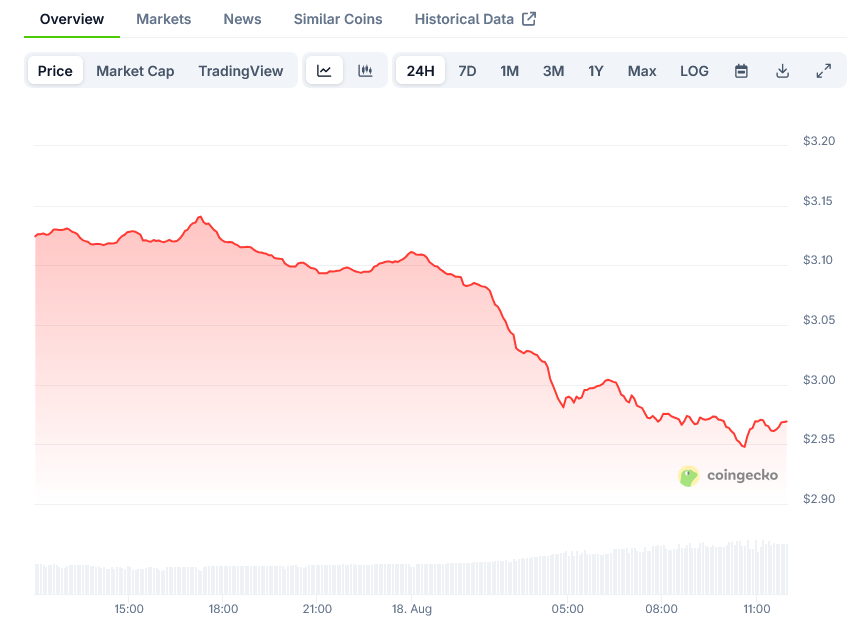
XRP, Ripple’s native cryptocurrency, has experienced a roller coaster of price action over the past few days. The digital asset is currently trading below the $3.05 level, showing some bearish signs while still maintaining crucial support zones.
On August 14, XRP suffered a dramatic 7% plunge within just 15 minutes. The price dropped sharply from $3.21 to exactly $3.00, causing a wave of liquidations across the cryptocurrency market. This sudden movement contributed to a massive $420 million in crypto liquidations, making it one of the most intense short-term selloffs in recent months.
Despite the alarming drop, XRP managed to hold at the $3.00 support zone. A low was formed at $2.97, and the price has been hovering around this level since. The quick recovery suggests that the movement might have been a liquidity hunt rather than a fundamental shift in market sentiment.
The price is now trading below $3.05 and the 100-hourly Simple Moving Average. This positioning below key technical indicators points to continued short-term bearish pressure.
Technical analysis reveals a bearish trend line forming with resistance at $3.06 on the hourly chart of the XRP/USD pair. The hourly MACD is gaining pace in the bearish zone, while the RSI remains below the 50 level, further confirming the current bearish momentum.
Potential Recovery Scenario
If XRP can clear the $3.06 resistance, it might move toward the $3.12 level. Breaking above this resistance could open the path to the $3.15 zone or the 50% Fibonacci retracement level of the downward move from the $3.35 high to the $2.97 low.
For a stronger recovery, bulls would need to push the price above $3.20, which represents a key hurdle on the upward journey. Successful clearance of this level could revive hopes for the previously projected target of $4.70.
Market watchers note that the broader bullish scenario has not been derailed by this correction. As long as XRP maintains price levels above the macro 0.5 Fibonacci retracement of $2.76, the long-term positive outlook remains valid.
Downside Risks
On the flip side, failure to overcome the $3.05 resistance zone could trigger a fresh decline. The immediate support lies near $2.96, with the next major support at $2.92.
A break and close below $2.92 might push the price toward the $2.85 support level. If this support fails to hold, the next target for bears would be the $2.80 zone, a breach of which could lead to a larger decline.
The rapid rejection from lower levels indicates that large traders might be using these liquidity zones to re-establish positions. This pattern of price action confirms the thesis that the decline was likely engineered and not based on fundamental news or macroeconomic factors.
For short-term guidance, the $3.11 level has become a critical reference point. Trading above this level could trap short sellers and potentially ignite fresh upward momentum.
The $3.00 mark represents a psychologically important support level that XRP has managed to defend so far. The fact that the price respected the 0.382 Fibonacci retracement at this level rather than breaking down to the 0.5 retracement at $2.76 is seen as a positive sign by technical analysts.
Current resistance levels to watch include $3.21, $3.41, and the all-time high area around $3.66. A decisive close above these areas could set up a significant breakout and resume the bullish trend.
The XRP price movement mirrors the volatility seen across the crypto market, with no definitive catalysts behind the recent turbulence.

