
 Price: Technical Analysis Points to Potential Drop to $2.40 Support Level")
TLDR
- XRP has fallen 16.8% in the past month after hitting its year-to-date high
- Smart money investors have reduced XRP holdings by 80% over the past 30 days
- XRP is trading below key moving averages, suggesting continued bearish momentum
- Daily active addresses have plummeted from over 600,000 in March to around 33,000 currently
- Technical analysis shows a bearish descending triangle pattern with a potential target of $2.40
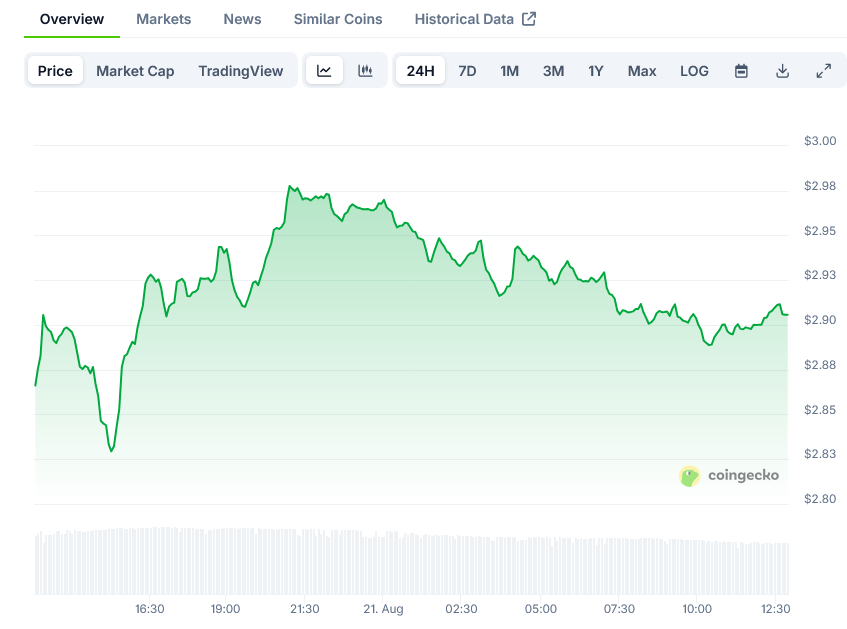
XRP, the third-largest cryptocurrency by market capitalization, is facing mounting pressure as several indicators point to continued price weakness in the near term. Currently trading at $2.93, XRP has experienced a 16.8% drop over the past month, despite being up 19% over the last three months and 63% higher than its year-to-date low.
The cryptocurrency’s market cap stands at $173.8 billion, with daily trading volume reaching $6.4 billion. While these figures might appear strong at first glance, a deeper look reveals concerning trends for XRP holders.
Data from Nansen shows that smart money investors have dramatically reduced their XRP exposure, with balances dropping by 80% over the past 30 days. This significant reduction is particularly worrying as these sophisticated investors often adjust their portfolios ahead of market shifts.
When smart money exits positions, retail investors typically follow suit, which can amplify price corrections. This pattern appears to be playing out with XRP currently.
Futures markets also paint a bearish picture for XRP. According to CoinGlass, open interest for XRP has fallen from $10.94 billion in July to $7.56 billion at the time of writing. This reduction signals waning speculative interest from traders.
The long/short ratio has dipped below 1, indicating that more traders are positioning for potential downside rather than upside movement.
Technical Outlook Confirms Bearish Sentiment
Technical analysis further supports the bearish case for XRP. The cryptocurrency has fallen below both its 20-day and 50-day moving averages, a classic sign that sellers have gained control of the market.
The Relative Strength Index (RSI) has formed a bearish divergence with price action. This divergence occurs when the RSI fails to confirm higher price levels, often signaling weakness in the prevailing uptrend.
Adding to the bearish signals, the Aroon Down indicator stands at 92.86% while the Aroon Up remains at just 7.14%, underscoring the strength of the current downtrend.
Chart analysis reveals a bearish descending triangle pattern that was recently broken to the downside. This pattern is characterized by a flat support line and a descending upper trendline. With the price breaking below the support at $2.95, technical traders are now eyeing a measured target of $2.40, representing a potential further drop of 18% from current levels.
On-Chain Activity Shows Cooling Demand
On-chain metrics for the XRP Ledger reveal a substantial decrease in network activity, reinforcing the bearish outlook. Weekly transactions have slumped 14.8% to 12.4 million, while weekly active addresses have dropped 2.1% to 107,340.
The decline in daily active addresses is even more dramatic when viewed over a longer timeframe. The network recorded robust activity of 608,000 daily active addresses on March 19 and 577,134 on June 16. However, this figure has collapsed to around 33,000 currently.
Transaction count has decreased by 51% from 2.5 million in June to 1.25 million at the time of writing. These metrics are critical indicators of blockchain adoption and user engagement, with their significant drops suggesting reduced interest in XRP.
Analyzing the 90-day spot taker cumulative volume delta (CVD) reveals intensifying sell-side activity. Since July 28, selling pressure has dominated the order book, following XRP’s rise to multi-year highs above $3.66 on July 18.
The negative CVD indicates profit-taking among traders, signaling waning demand as sellers take control of the market.
With more than 91% of the XRP supply still in profit at current prices, investors could continue locking in gains, adding to the downward pressure.
Given these signals, XRP appears positioned for a potential correction toward $2.70, a level that previously acted as key support during its August decline. A decisive break below this threshold could open the way for a further drop toward $2.30-$2.40.
XRP’s earlier gains this year came amid investor optimism following Ripple’s legal victory against the U.S. Securities and Exchange Commission, along with anticipation of a potential spot XRP ETF. However, these bullish catalysts appear to have been fully priced in, with focus now shifting to weakening network fundamentals.

