
 Price: Technical Analysis Shows Bearish Pattern as Cryptocurrency Trades Below $3")
TLDR
- XRP price is trading below $2.90 and the 100-hourly Simple Moving Average
- A bearish trend line is forming with resistance at $2.920
- XRP could continue to decline if it falls below $2.80 support level
- Technical indicators suggest a possible correction toward $2.07
- Despite short-term bearish signals, some analysts maintain a bullish long-term outlook
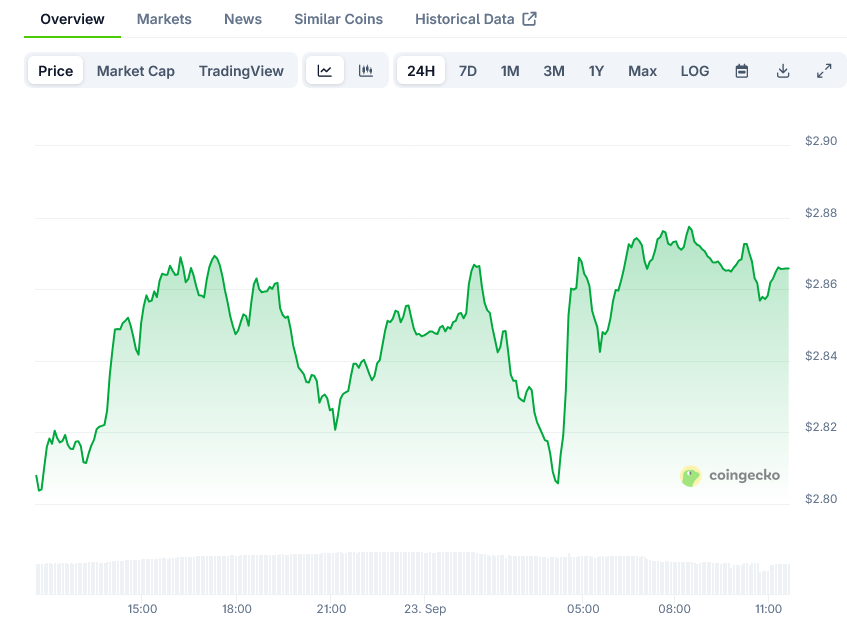
XRP, the cryptocurrency associated with Ripple, is showing bearish signs in its recent price action, falling below the $3 mark and struggling to maintain momentum. The price is currently hovering around $2.80, representing a 5% decline over the past 24 hours.
The downward movement began after XRP failed to extend gains above $3.120 and started a fresh decline, similar to price movements seen in Bitcoin and Ethereum. Bears pushed the price below several key support levels at $3.00 and $2.920, eventually reaching as low as $2.678.
While there has been a slight recovery, XRP remains trading below both $2.90 and the 100-hourly Simple Moving Average, suggesting continued bearish pressure in the near term. Technical analysis shows a bearish trend line forming with resistance at $2.920 on the hourly chart.
If buyers can defend the $2.80 support level, the price might attempt a steady recovery. The first major resistance level sits near $2.90, followed by a more substantial barrier at $2.920. This resistance area coincides with the 50% Fibonacci retracement level of the recent decline from $3.138 to $2.678.
A clear move above $2.920 could potentially send XRP toward the $3.00 resistance level. Further gains might push the price to $3.050, with the next major hurdle for bulls near $3.120.
Technical Analysis Signals Caution
The descending triangle formation visible on the daily chart is particularly concerning for XRP holders. This pattern, marked by a downward-sloping resistance trend line and a flat horizontal support line, typically signals bearish continuation.
If XRP closes below the triangle’s support trend line around $2.75, it could trigger a fresh sell-off with a technical target near $2.07. This would represent a substantial 26% drop from current prices.
The technical indicators offer little comfort to bulls. The price is trading below both the 50-day and 100-day simple moving averages. The Relative Strength Index (RSI) has dropped from 50 to 39 over the last 24 hours, indicating increasing downward momentum.
On the hourly timeframe, the MACD for XRP/USD is losing pace in the bearish zone, while the RSI remains below the 50 level, both suggesting continued weakness.
Long-Term Bullish Case Remains
Despite the current bearish trend, not all analysts are convinced this represents the end of XRP’s upward journey. On higher timeframes, some analysts see a bullish case developing.
Weekly chart analysis shows a bull flag pattern that has been in play since November 2024, with some projections suggesting XRP could potentially reach as high as $15 if this pattern plays out.
Crypto analyst CryptoBull has identified a similar setup, predicting XRP could rally to $5 in October. Others point to an ascending triangle formation on the monthly chart with a price target as high as $27.
XRP’s Net Unrealized Profit/Loss (NUPL) metric currently sits within the 0.5-0.6 zone, a level historically linked with local tops. With more than 94% of supply in profit at current prices, there is a chance of increased selling pressure.
#XRP Update: 3-Day Time Frame 🔍:
👉It looks like the 50 EMA is on track to meet #XRP around $2.77. If we break through this target, we could see further downside, which isn’t what we want to hear! 😬
👉I know you might be tired of hearing me stating $2.65, but this level… https://t.co/sOw3oVDAAz pic.twitter.com/aFiH4INOcv
— EGRAG CRYPTO (@egragcrypto) September 22, 2025
Similar NUPL readings in 2017, 2021, and January 2025 preceded sharp corrections, raising the possibility that XRP could experience further pullbacks in the coming days.
Major support levels to watch include $2.820 and $2.80, with more substantial support at $2.650. On the resistance side, $2.90 and $2.920 represent the immediate barriers to recovery.
The 200-day simple moving average sits at $2.52, which could provide relief for bulls and potentially prevent a deeper correction toward $2.00 if current support levels fail.
For now, XRP’s price action remains tied to its ability to hold above the crucial $2.80 support zone. A drop below this level would likely accelerate the downside movement, while a recovery above $2.920 could signal a potential trend reversal.
XRP is currently down 5% over the last 24 hours and trades at $2.80.

