

TLDR:
- Binance XRP CVD recorded a negative reading of -4.56M XRP, showing sell orders continue to dominate the market.
- The 30-day price-CVD correlation stands at 0.81, linking recent XRP price moves to real trading activity.
- XRP RSI climbed to 44.7 from oversold levels below 30, pointing to weakening bearish pressure and early recovery.
- XRP faces key resistance at $1.25–$1.30; a breakout could fuel recovery while failure risks a $1.10 retest.
Binance XRP CVD data continues to reflect weak buying momentum across the XRP market. The Cumulative Volume Delta recorded a negative reading of approximately -4.56 million XRP, showing that sell orders dominate over buy orders.
XRP traded near $1.18 with a 24-hour volume of $1.94 billion as of this writing. The token posted a 2.84% price decline in the past 24 hours but gained 7.78% over the prior seven days.
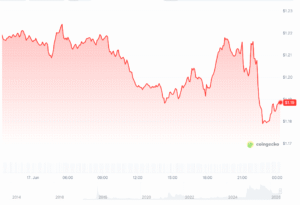
Source: Coingecko
CVD Correlation Points to Genuine Market Activity
The 30-day price-CVD correlation coefficient stands at roughly 0.81. That level points to a strong positive relationship between price movements and actual trading flows. As a result, recent XRP price action appears driven by real market activity rather than thin liquidity conditions.
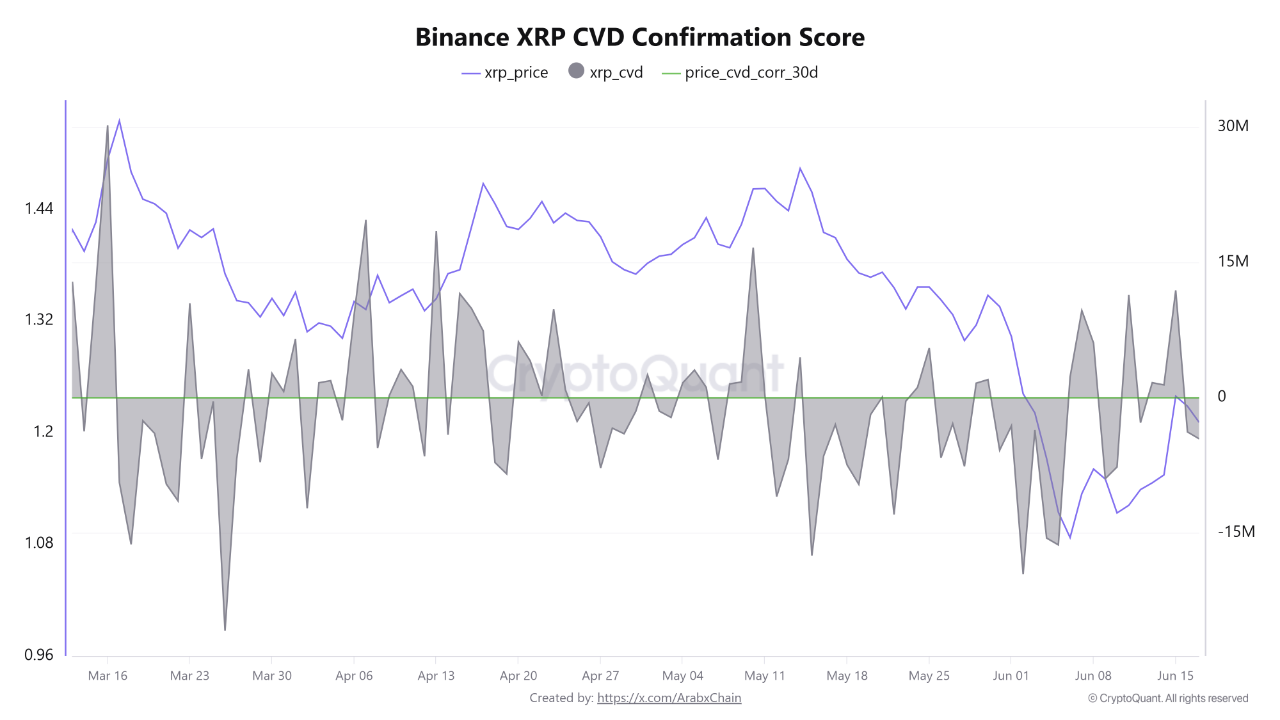
Source: CryptoQuant
The relatively high correlation reading carries weight for traders monitoring XRP’s near-term direction. When price and CVD move together closely, the data tends to reflect actual supply and demand dynamics more accurately. This makes the persistently negative CVD reading more telling, not less.
Selling pressure continues to weigh on the market despite the price holding above the $1.18 level. This pattern points to ongoing distribution activity by market participants at current price levels. That activity is limiting XRP’s ability to mount a stronger recovery or build a sustained short-term uptrend.
Any shift toward positive CVD readings could provide additional support for the price and signal improving buying interest.
Conversely, continued negative readings may suggest that market conditions remain tilted in favor of sellers. Traders are closely watching CVD developments for early signs of a shift in that balance.
XRP Technical Structure Shows Early Recovery Signals
XRP on the daily timeframe is attempting a recovery after a sharp June selloff. Price dropped from the $1.35 region to a local low near $1.08 before rebounding toward $1.23. Profit-taking then pulled the price back to around $1.18.
Despite that pullback, momentum indicators are improving. The RSI has climbed to 44.7 from oversold territory below 30. That move signals weakening bearish pressure and growing buying interest in the market.
The MACD is also turning bullish, with the histogram printing positive bars. The MACD line is approaching a crossover above the signal line, which traders typically read as a shift in short-term momentum.
Volume expanded during the rebound, suggesting genuine demand rather than a weak technical bounce.
However, XRP remains below key resistance around the $1.25–$1.30 range. A break above that zone could trigger a stronger recovery phase.
Failure to clear that resistance may invite another retest of the $1.10 support area, keeping the overall picture cautious for now.

