



TLDR
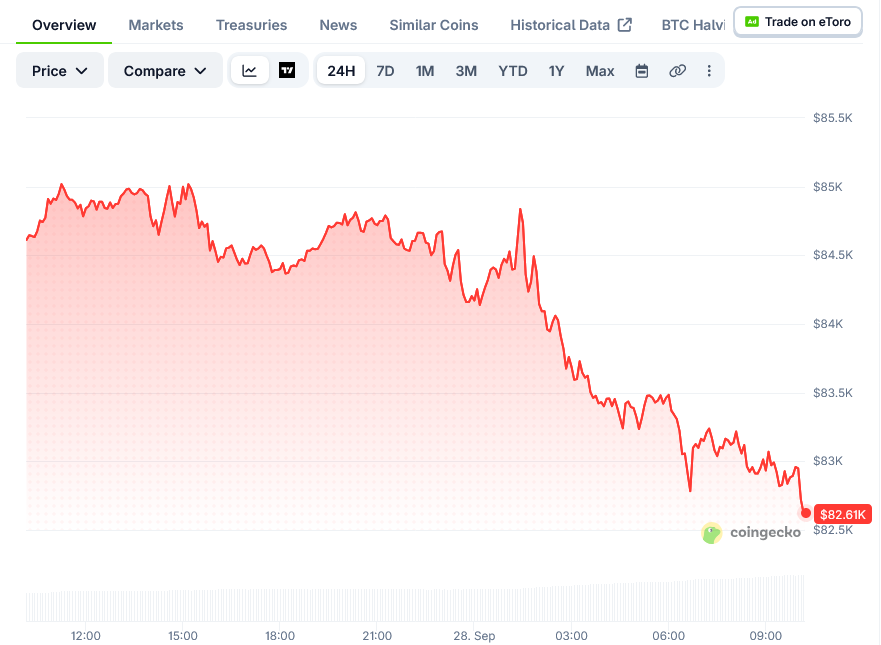
- Bitcoin fell below $84,000 on Monday after hitting a seven-day high above $87,000 last week.
- Trump rejected an Iranian plan to reopen the Strait of Hormuz, bringing geopolitical risk back to markets.
- U.S. spot Bitcoin ETFs took in $2.39 billion in net inflows during the Sept. 21–25 week.
- Analyst Wealthmanager said leverage is being flushed and named $80,300 as possible support.
- Traders are watching U.S. PCE inflation data on Sept. 30 and jobs data on Oct. 2.
Bitcoin fell below $84,000 on Monday after reaching a seven-day high above $87,000 last week. The drop came as renewed U.S.-Iran tensions weighed on risk assets.
BTC traded at $83,208 early Monday, down 1.55% over 24 hours. It slipped from $85,159 to a session low of $82,705 before recovering toward the $84,000 area.
The asset remains well above its mid-September lows. CoinGecko data shows BTC closed near $75,590 on Sept. 15 before climbing above $86,000 less than a week later.
Iran Tensions Weigh on Markets
President Donald Trump rejected an Iranian proposal to reopen the Strait of Hormuz and pause fighting. The plan, presented at the United Nations General Assembly, included a seven-day window before further talks.
Iranian Foreign Minister Abbas Araghchi said Tehran was still open to a diplomatic deal but “fully prepared” if fighting resumed. Trump said he expected the conflict to end “very soon” but did not rule out more U.S. strikes.
Oil prices stayed sensitive to the news. WTI crude futures traded above $93 early Monday, and the 10-year Treasury yield has moved above 5% since the conflict began.
ETF Demand and Trader Positioning
Despite the pullback, U.S. spot Bitcoin ETFs recorded $2.39 billion in net inflows during the Sept. 21–25 week, according to Farside Investors. Every session showed positive flows, with BlackRock’s IBIT taking in around $1.16 billion.
Crypto analyst Wealthmanager said on X that BTC open interest has returned to the level seen before the last price advance. The analyst noted leverage is being flushed while price holds $84,000–$85,000, and said the previous reset led to a move toward $87,000.
Wealthmanager called the setup bullish but said shorter time frames still show a bearish structure. The analyst pointed to $80,300 as possible support if the pullback continues.
Derivatives data shows a split market. The funding rate sits at a neutral 0.0020%, and open interest rose just 0.38% to nearly $8 billion.
Top traders on Binance hold a long/short ratio of 1.38, while retail traders sit at 1.27. However, the taker buy/sell ratio of 0.79 shows market sell orders are outpacing buys.
Technical indicators show momentum cooling. The MACD histogram is flat at zero, the RSI stands at 59.71, and the Money Flow Index reads 59.35.
BTC trades above its 50-day moving average of $76,495 and its 200-day average of $71,172. It has slipped below its 7-day average of $84,461.
Trader Merlijn The Trader shared a chart comparing BTC’s current pattern with Google’s recovery after 2021. The trader questioned whether Bitcoin could follow a similar path.
Resistance sits between $86,000 and $87,000. Immediate support is at $82,222, followed by $81,236 and the 20-day average near $80,691.
Traders are now watching upcoming U.S. economic data. August Personal Consumption Expenditures figures, the Fed’s preferred inflation gauge, are due Sept. 30, with September jobs data following on Oct. 2.

