



Key Highlights
- BTC fell sharply from $79,500 to sub-$76,000 levels, sparking approximately $547 million in liquidations across the market
- Leveraged long traders suffered most severely, with more than $659 million in forced exits during a single 24-hour period
- Spot Bitcoin ETFs in the United States recorded $307.45 million in net inflows on August 21, marking five consecutive days of positive flows
- Market watchers identify potential downside zones ranging from $71,000 down to $68,000 should bearish momentum persist
- Critical macroeconomic catalysts including PCE inflation data, Nvidia’s quarterly report, and Jackson Hole symposium may shape BTC’s trajectory
Bitcoin experienced a dramatic pullback from approximately $79,500 — representing its strongest price level in recent months — plunging beneath the $76,000 threshold in a rapid decline that blindsided overleveraged market participants. The sudden downturn resulted in roughly $547 million worth of cryptocurrency liquidations before demand returned to stabilize prices.
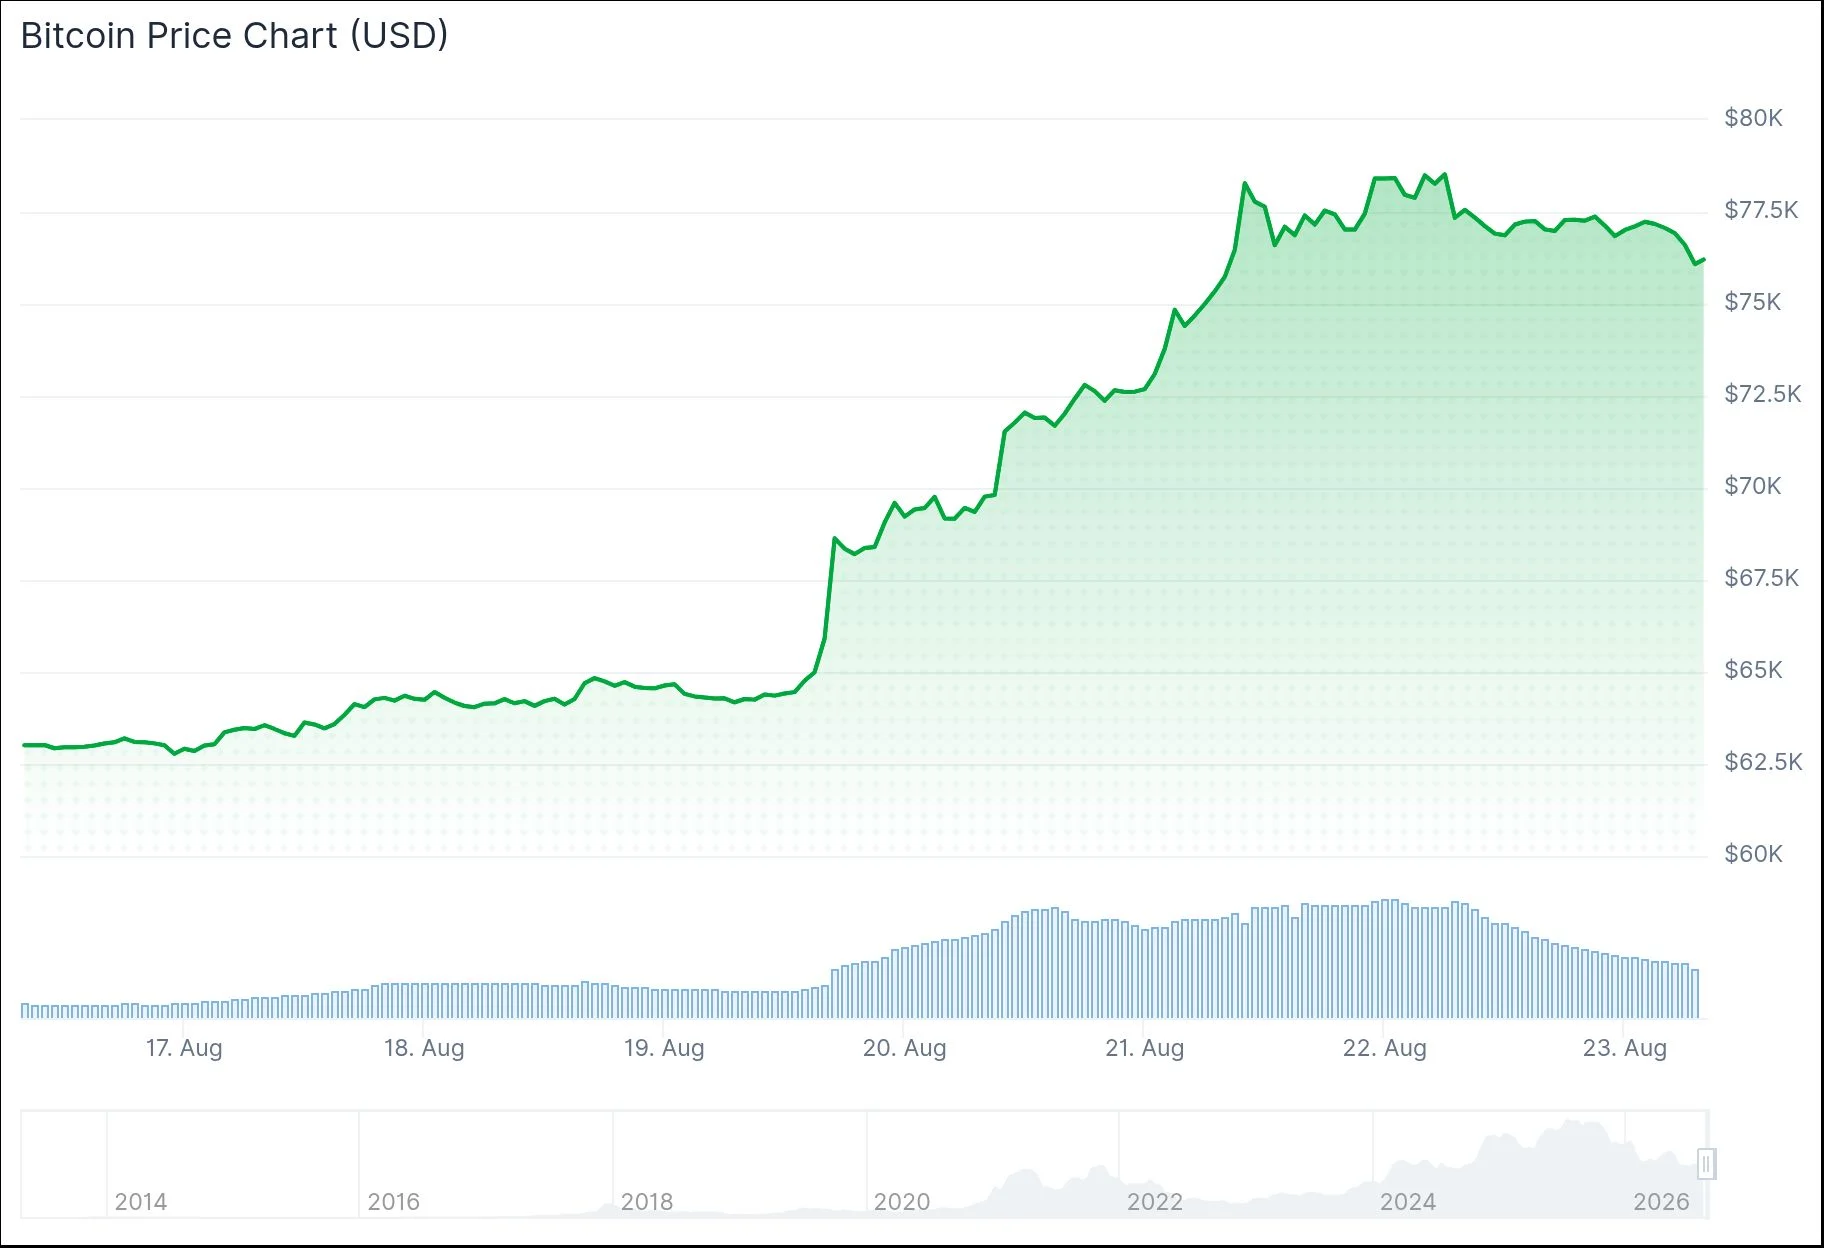
As of the latest data, BTC was changing hands near $77,291, representing a 0.43% decline.
The volatility revealed underlying market fragility that wasn’t immediately apparent. Bullish positions absorbed the majority of losses, representing approximately $659 million in liquidated trades versus merely $148 million on the bearish side — creating a lopsided ratio exceeding four to one.
Within trading venues such as Hyperliquid, individual long position liquidations spanned from $23 million up to $48 million, demonstrating the extreme exposure certain market participants had accumulated.
Blockchain data specialist Maartunn identified concentrated bullish positioning as the primary catalyst behind the cascade. When Bitcoin breached critical liquidation thresholds, automatic selling mechanisms intensified the downward pressure. Maartunn observed that liquidity clusters are now forming above the $78,300 mark, with supplementary pools extending lower toward the $68,000 region.
Market Expert Perspectives
Technical analyst P4 Provider highlighted the $79,000 zone as critical resistance following Bitcoin’s sweep of liquidity pools positioned above that threshold. P4 Provider additionally referenced bearish RSI divergence patterns, increasing USDT dominance metrics, and heightened funding rates as cautionary indicators. Projected downside scenarios span from $77,000 to $71,000, with $70,000 representing a more substantial support zone should selling intensity escalate.
Market analyst Daan Crypto Trades (@DaanCrypto) shared observations via social media indicating the present weekly BTC candle ranks among the largest 5% of candles recorded over the preceding eight years. He emphasized that the monthly candle shows less extension, positioning within the 32nd percentile. Daan highlighted that during 61% of bullish monthly periods, the peak emerges later than the current timing — implying the existing high could potentially be surpassed, while acknowledging no outcome is certain.
Such volatility episodes have occurred previously. During May’s decline, when Bitcoin tumbled below $75,000, total liquidations reached approximately $923 million, with long positions representing over 90% of the eliminated capital.
Upcoming Economic Catalysts
Notwithstanding the recent selloff, positive demand indicators persist. United States spot Bitcoin ETFs registered $307.45 million in net capital inflows on August 21, continuing a five-day positive flow sequence.
On August 26, the United States Bureau of Economic Analysis will publish second-quarter GDP figures alongside July PCE inflation metrics. Nvidia’s quarterly earnings announcement is scheduled for the same date. Federal Reserve Chair Kevin Warsh delivers remarks at the Jackson Hole economic symposium on August 28.
Maintaining support above the $77,000 level represents the near-term priority for Bitcoin bulls.

