
 Surges Past $76K Amid Historic Negative Funding Rate Streak")
TLDR
- Bitcoin reached $76,120 on Tuesday before retracing to approximately $74,400
- Negative funding rates have persisted for 46 consecutive days, a pattern not seen since the FTX collapse
- Spot Bitcoin ETFs in the United States recorded $411.41 million in net inflows on Tuesday
- Daily transaction volume surged 62% in 2026, reaching 17-month peak levels
- Market analyst CW8900 identifies current network activity as exhibiting “bull market behavior”
Bitcoin (BTC) surged to a session high of $76,120 on Tuesday, marking its strongest price level in 70 days, before consolidating around the $74,400 mark. The upward momentum was fueled by strengthening on-chain metrics, robust ETF capital flows, and reduced geopolitical uncertainty.
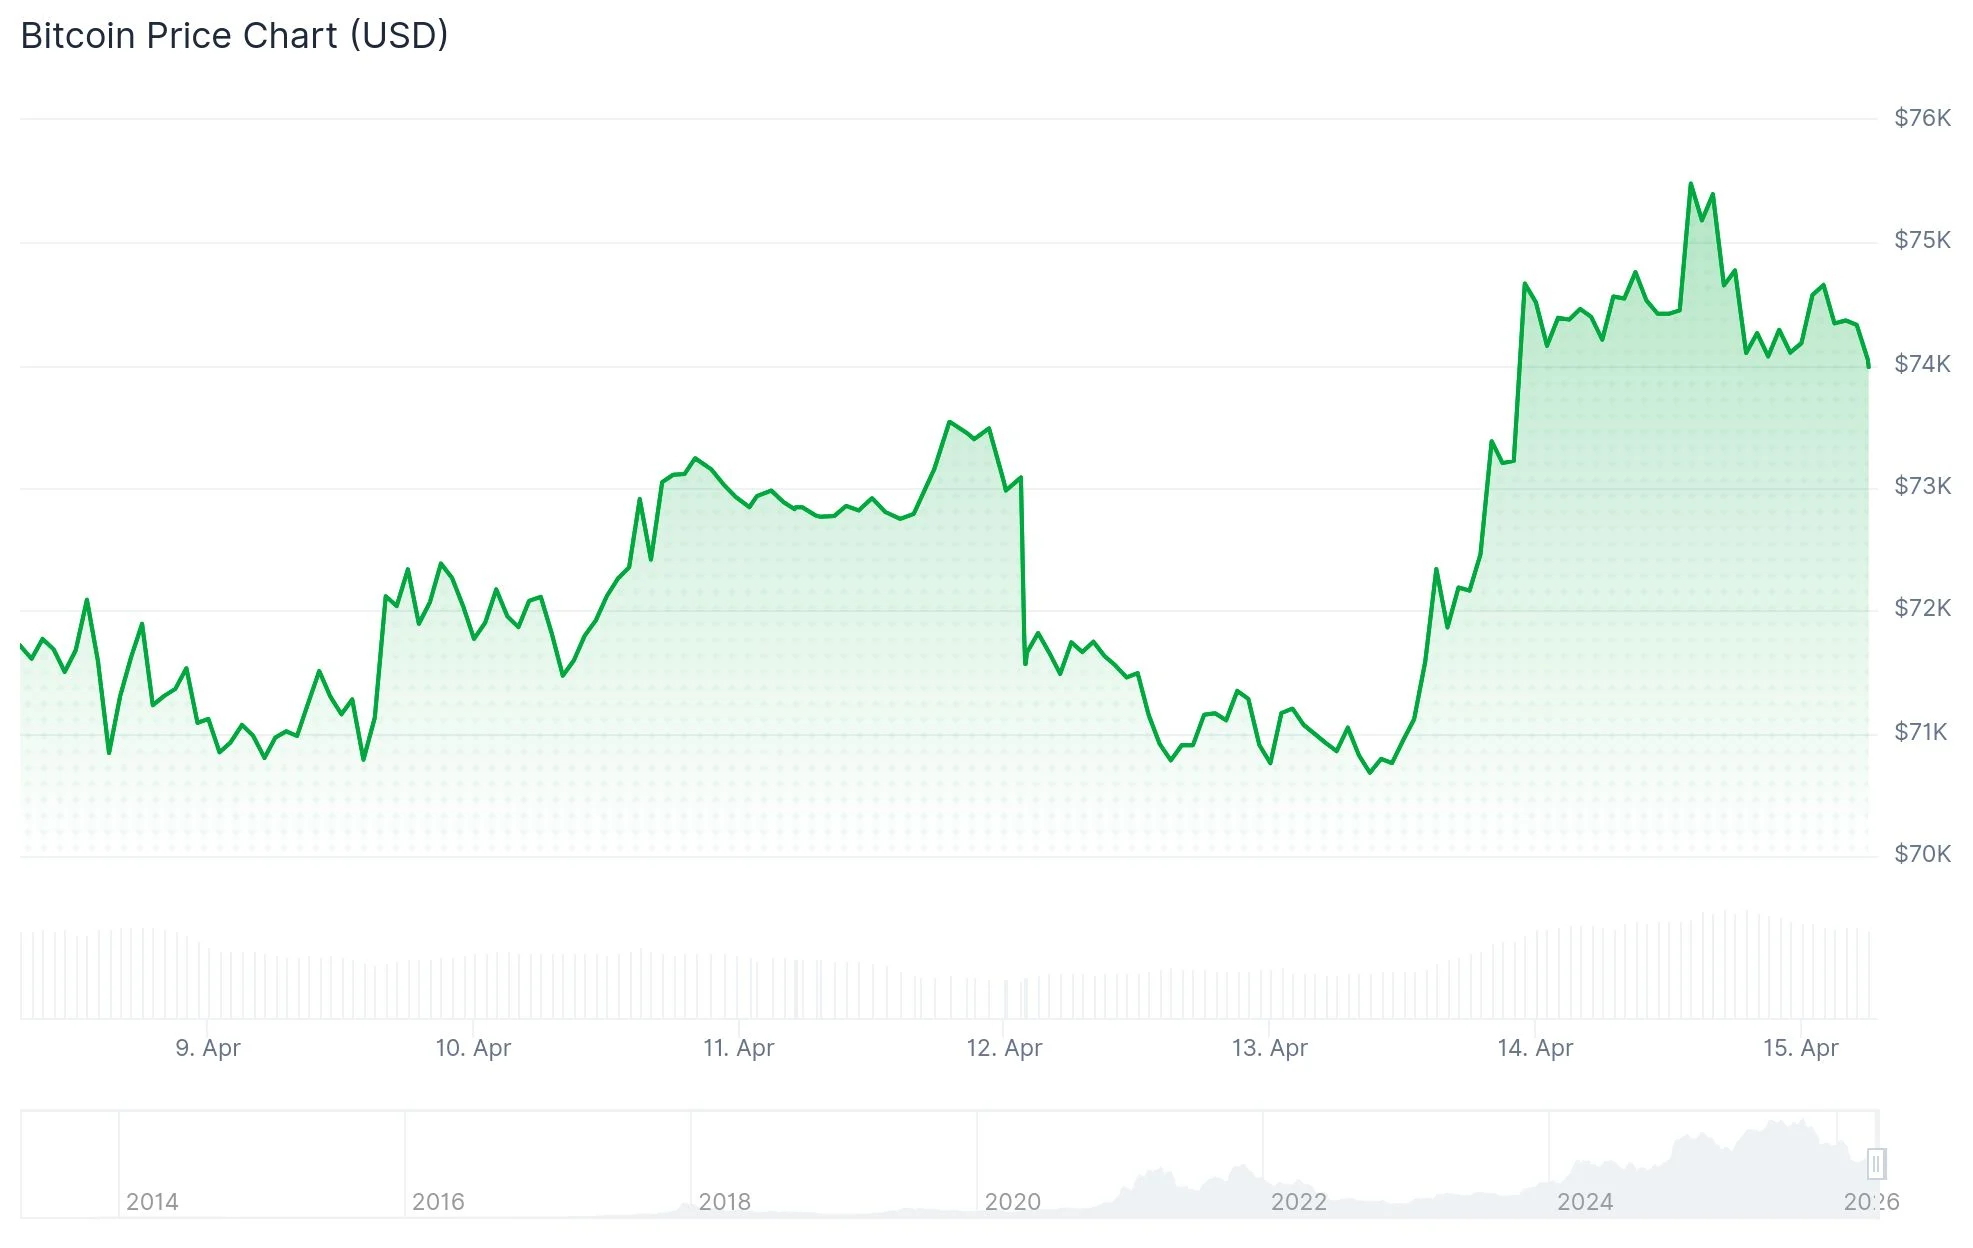
The $76,000 threshold has represented a significant resistance zone for more than two months. While Bitcoin momentarily penetrated this barrier, it subsequently retreated, prompting market participants to monitor whether buyers can sustain positions above this critical level.
From a technical perspective, Bitcoin pierced the upper boundary of an ascending triangle formation at $73,000 on Monday. A confirmed daily settlement above $75,000 would substantiate the breakout pattern. Following confirmation, the subsequent resistance zones are positioned at $80,000, followed by the triangle’s projected target around $89,050.
The daily Relative Strength Index has advanced to 63, recovering substantially from oversold territory at 15 recorded in early February. Meanwhile, the MACD histogram continues expanding, suggesting sustained bullish momentum in the near term.
Crypto analyst CryptoBlockto observed on X that Bitcoin “surged above the $76,000 level, breaking above its March highs and signaling renewed bullish momentum.” The analyst emphasized that maintaining prices above $76,000 would confirm a trend reversal.
Transaction Volume Reaches 17-Month Peak
Bitcoin’s daily transaction count has increased 62% year-to-date in 2026, hitting 765,130 on April 5. This figure corresponds to activity levels last observed in November 2024, when Bitcoin initially surpassed the $100,000 threshold.
Market analyst CW8900 stated on X: “$BTC daily transaction count is higher than when $BTC was $120K. The network is showing bull market behavior.”
Aggregate fee volume has also expanded 4% over the preceding week to $153,700. Glassnode characterized this development as “heightened on-chain demand,” interpreting it as evidence that network participants are prepared to pay premium fees for transaction confirmation priority.
Strong ETF Demand and Contrarian Funding Signal
US-based spot Bitcoin ETFs attracted $411.41 million in net inflows on Tuesday following a $291.11 million outflow on Monday. Combined net assets across all Bitcoin ETF products currently total $94.09 billion, with aggregate net inflows reaching $57.28 billion.
Vetle Lunde, K33 Research’s head of research, highlighted that funding rates for Bitcoin perpetual contracts on Binance have remained in negative territory for 46 consecutive days, even as open interest expands. This dynamic indicates traders are opening fresh short positions rather than closing existing ones.
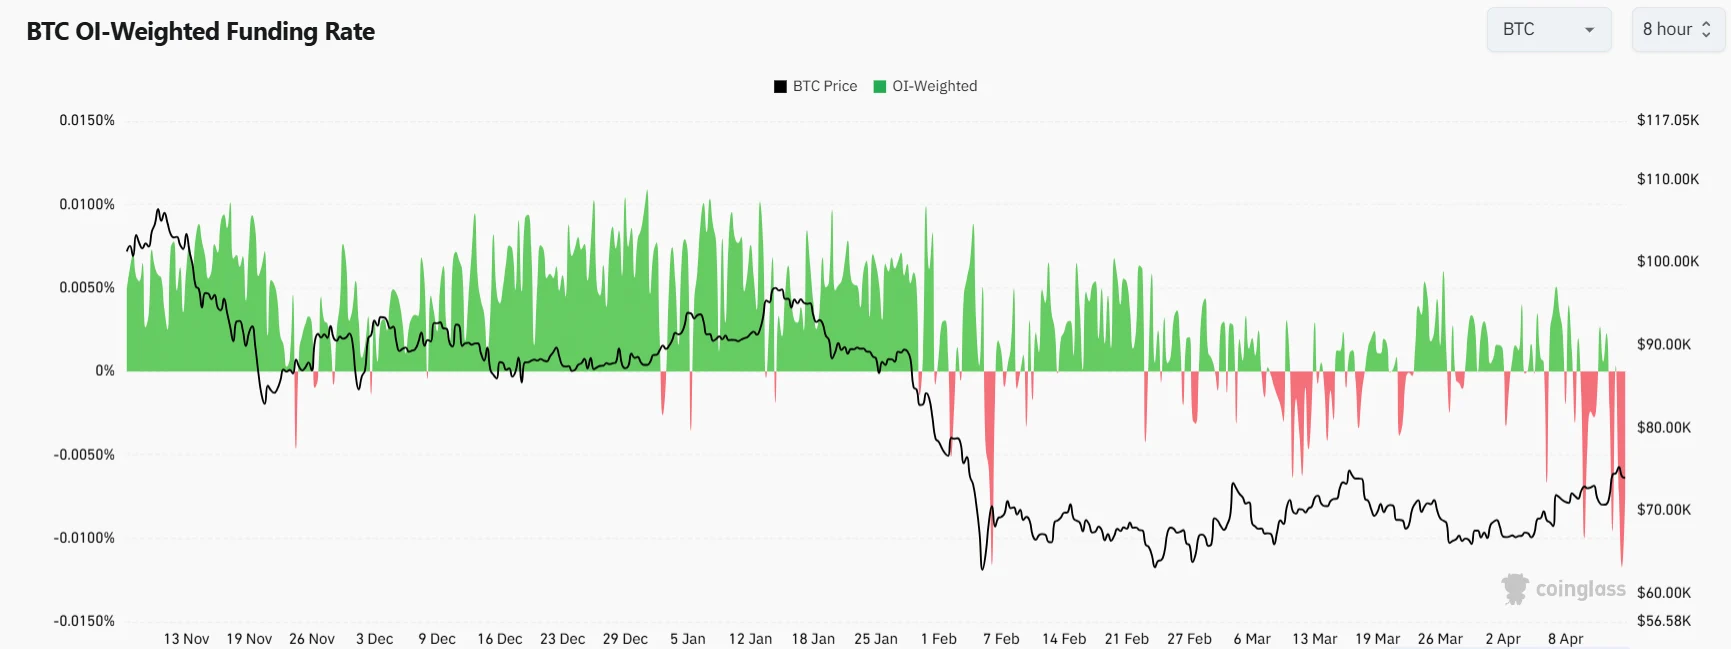
“Comparable risk-off regimes have historically been attractive entry points for BTC,” Lunde noted. The previous instance of sustained negative funding rates occurred following the FTX collapse in late 2022, which ultimately established the bottom of that cycle’s bear market.
Should selling pressure intensify, initial support rests at the 50-day exponential moving average near $71,021, with additional downside targets identified at $68,950 and $67,412.

