



TLDR:
- Bitcoin ETF inflows reached $433 million on September 18, with Fidelity’s FBTC contributing $310.72 million, or about 72% of the total.
- Fidelity and BlackRock captured about 97% of the day’s net inflows, while total U.S. spot Bitcoin ETF assets stood at $102.53 billion.
- Bitcoin traded near $81,330 as the daily RSI rose to 64.48, with liquidation data showing a dense liquidity cluster around $81,800 to $82,000.
- A break above $83,000 would extend the recent recovery range, while a loss of $80,000 could shift attention toward $78,300 to $78,700 support.
Bitcoin ETF inflows accelerated on September 18 as U.S. funds attracted $433 million net. Fidelity’s Wise Origin Bitcoin Fund led with $310.72 million, equal to 72% of the total. BlackRock’s IBIT added $108 million, leaving the two products with about 97% of the day’s inflows.
The surge arrived as Bitcoin price pushed toward $81,000 and tested technical resistance. Market data showed U.S. spot Bitcoin ETF assets at $102.53 billion, equal to about 6.29% of Bitcoin’s market value. The rebound followed nearly $746 million in midweek ETF outflows. It offset part of the selling pressure seen earlier in the week.
Bitcoin ETF Inflows Concentrate in Fidelity and BlackRock
The Fidelity Bitcoin ETF posted its strongest contribution to the September 18 session, exceeding other spot Bitcoin products. The $310.72 million daily inflow equaled three quarters of the fund’s nine-day August buying streak. That earlier run brought in about $413.1 million across consecutive sessions.
FBTC has gathered roughly $10.36 billion in net inflows since its January 2024 launch. That places the fund behind BlackRock’s IBIT among U.S. spot Bitcoin ETFs by capital attracted. The market now holds more than $102 billion through these products.
Bitcoin ETF inflows show how demand can become concentrated across a small number of funds. Fidelity and BlackRock captured nearly all net additions during the session. Other products accounted for a small share of the $433 million total.
The September 18 reversal marked a change in daily flow direction after the earlier midweek selloff.
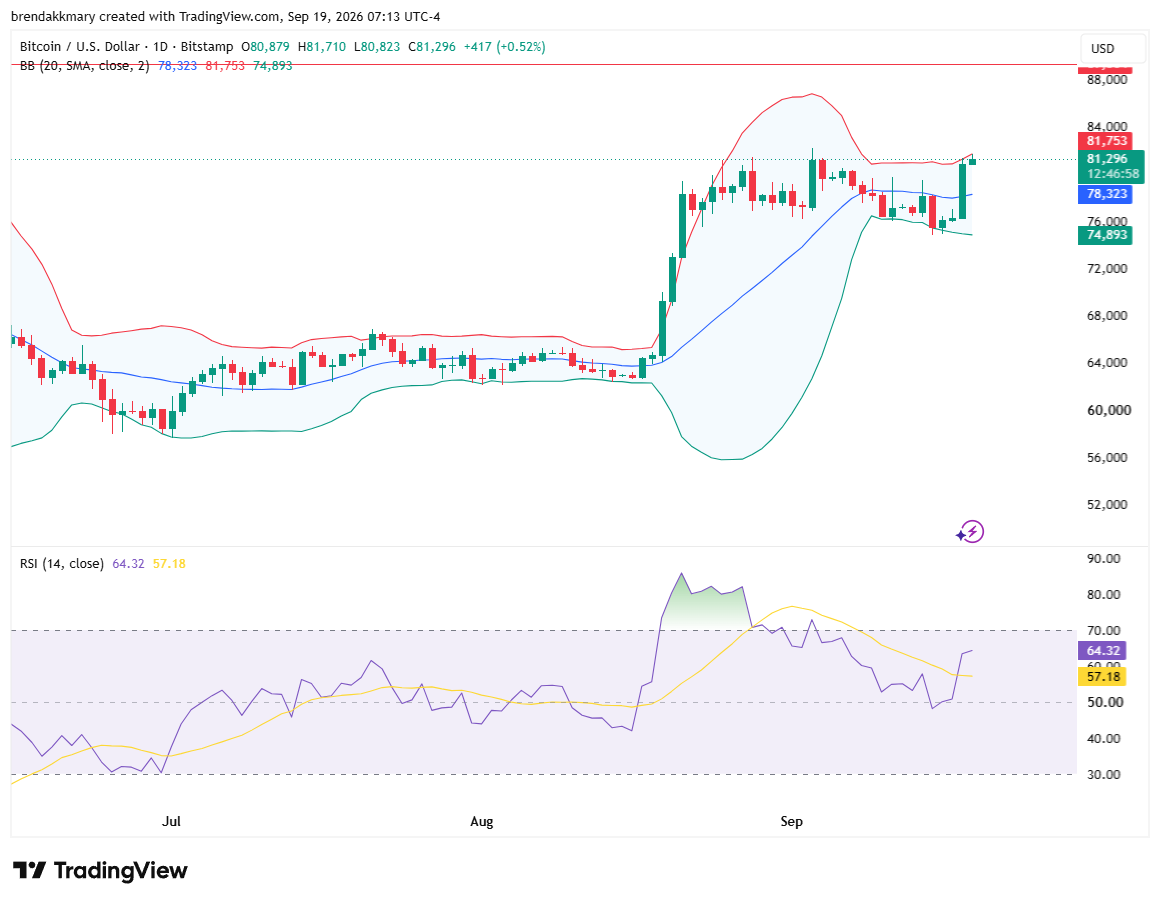
That shift coincided with a recovery in Bitcoin price. BTC traded near $81,330 on September 19 after moving above the 20-day Bollinger midpoint at $78,346. The upper Bollinger Band stood near $81,745, placing price close to a short-term test.
Bitcoin ETF inflows can support spot demand when funds create new ETF shares. However, daily flows do not guarantee continued price gains. Fund activity, derivatives positioning, macro policy, and profit-taking can all affect the next move.
Bitcoin Price Tests $82,000 Liquidity and $83,000 Resistance
Bitcoin’s daily RSI rose to 64.48, above its signal average of 57.25. The reading showed stronger momentum without crossing the 70 level often linked to overbought conditions. Other indicators also leaned positive, including a bullish Supertrend and a positive Aroon spread.
CoinGlass liquidity data showed a dense cluster between roughly $81,800 and $82,000. Additional liquidation zones appeared around $82,500 to $83,000 and near $84,000. These areas could attract price if buying pressure continues through the current range.
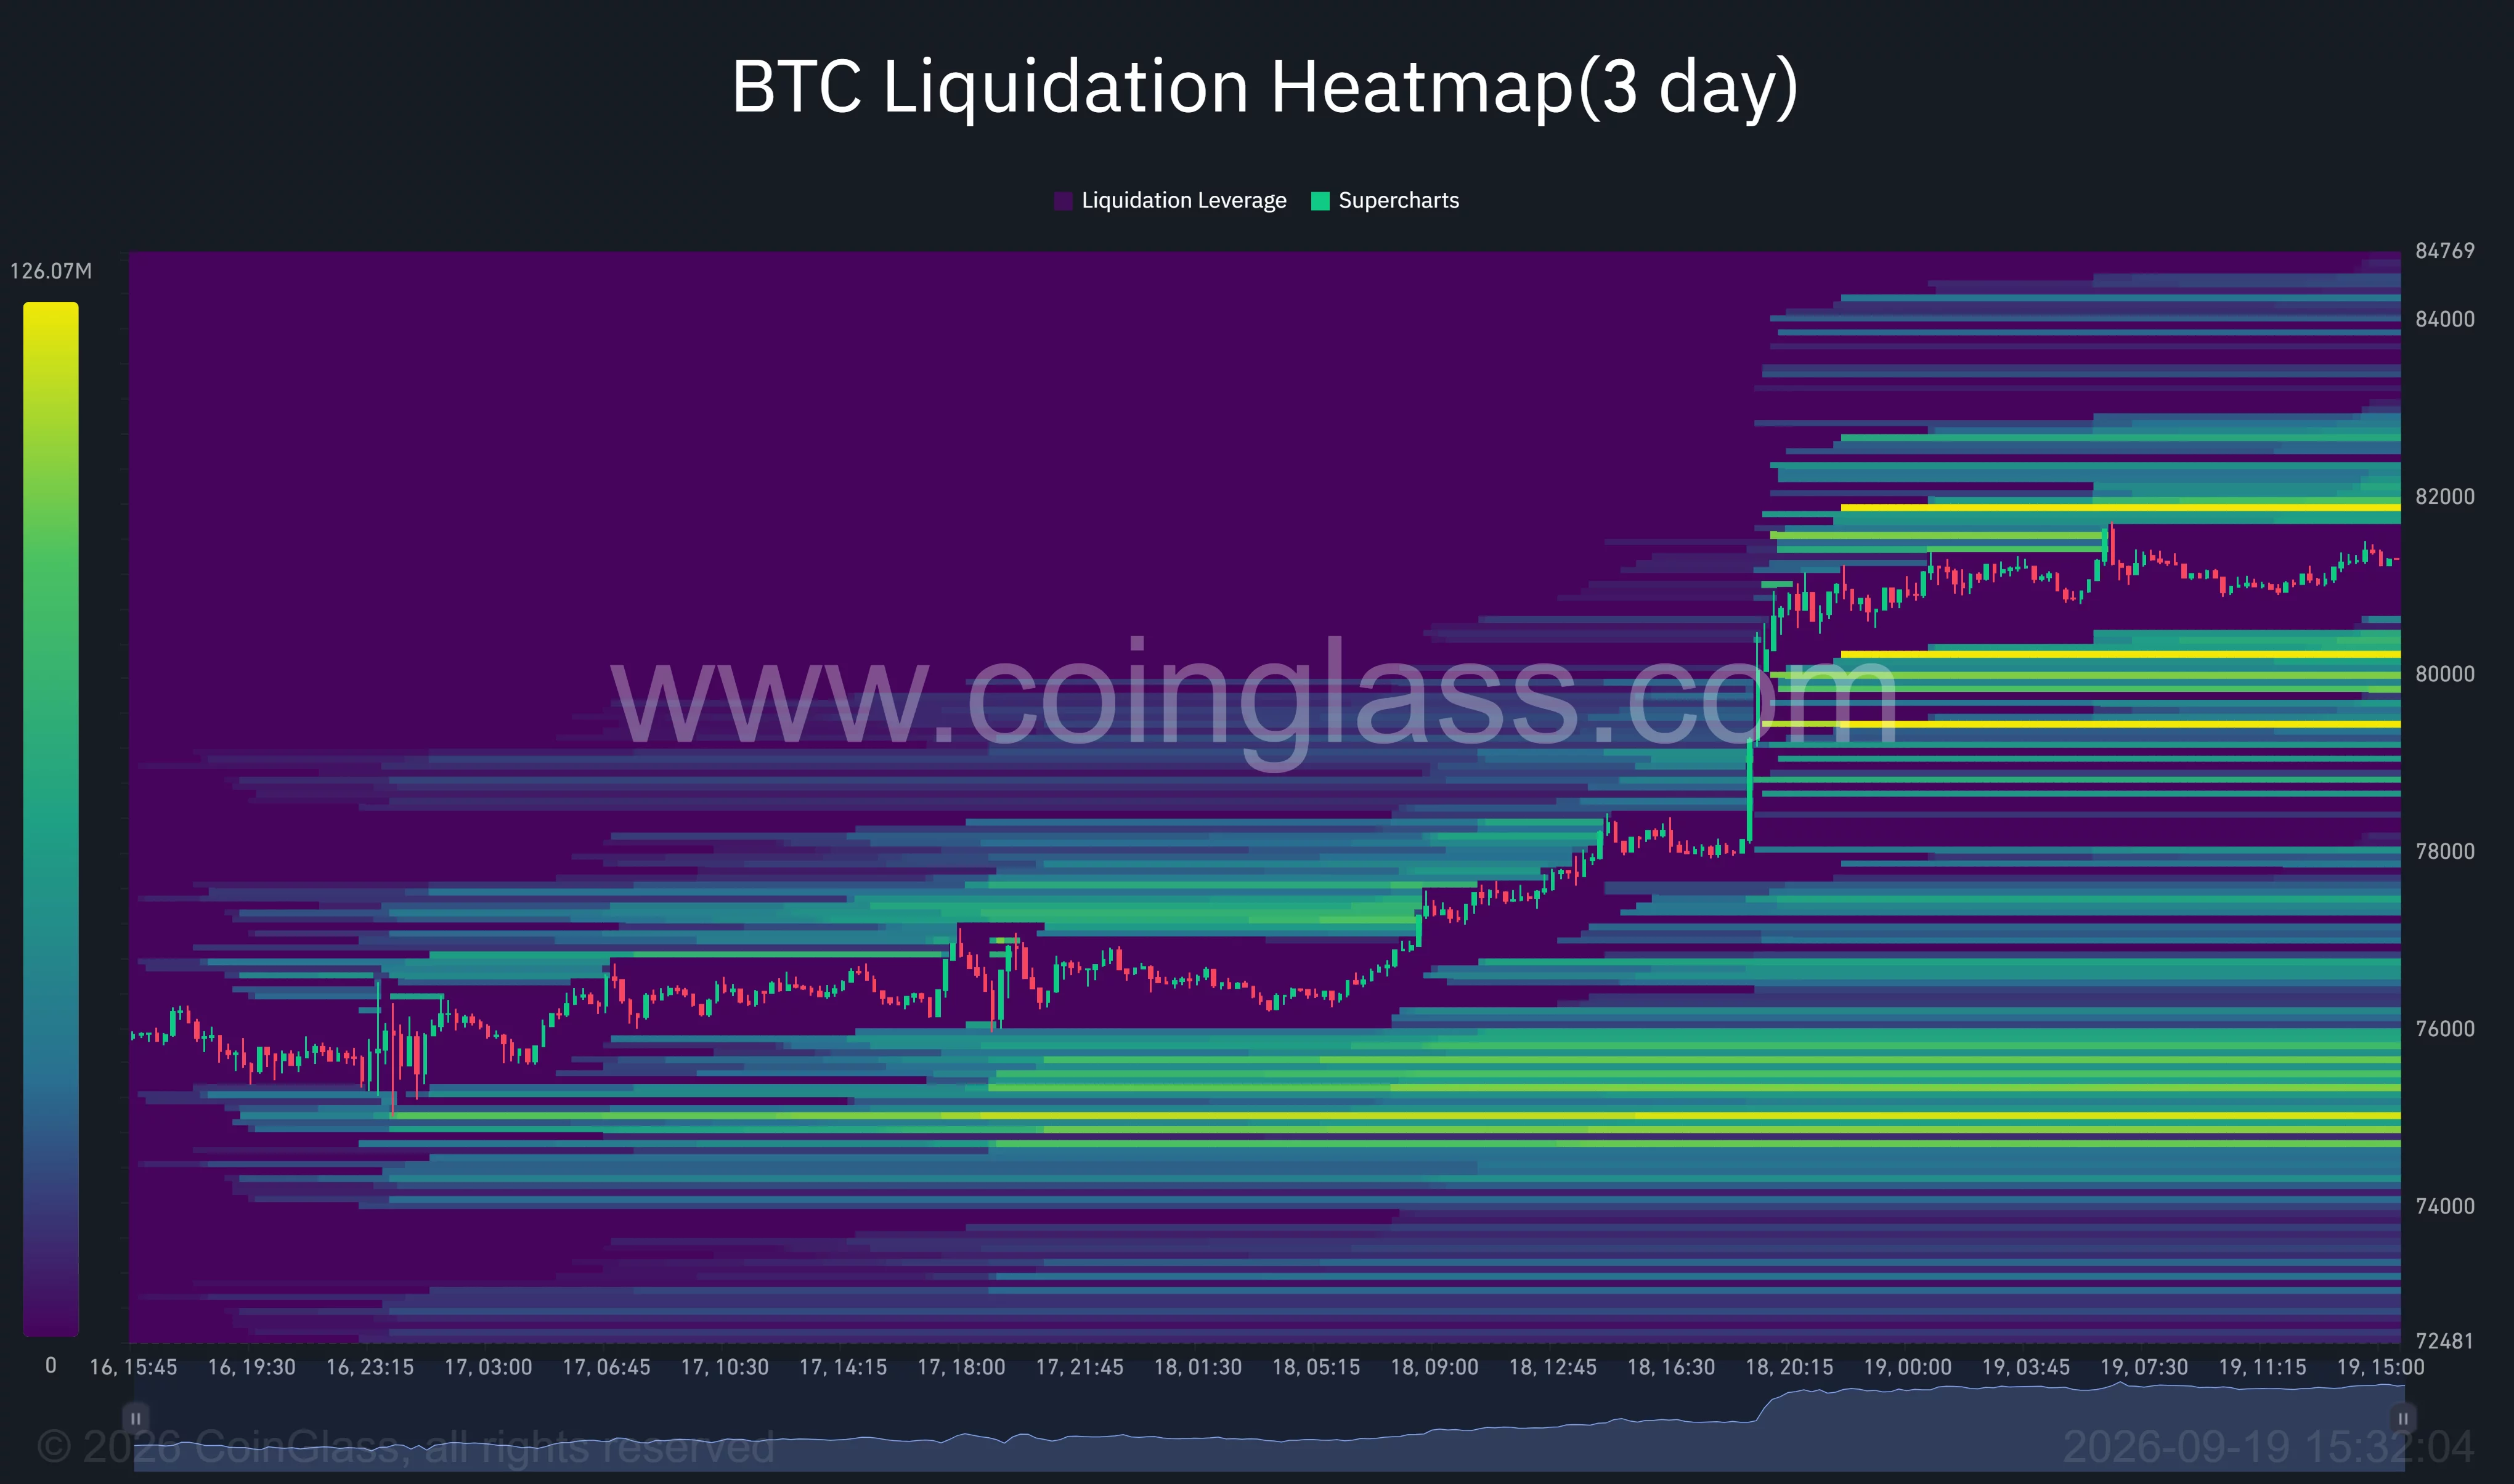
Bitcoin ETF inflows add another demand signal as BTC approaches those levels. Still, the market faces nearby downside liquidity around $80,000 and $79,400. A larger support zone sits between $78,500 and $79,000, close to the four-hour Supertrend and daily Bollinger midpoint.
Technical traders are also watching $83,000. A sustained break above that level would move Bitcoin beyond the upper part of its recent range. It would also place $85,000 in view as the next nearby level.
Failure to hold $80,000 would shift attention back toward $78,300 to $78,700. A deeper decline could reopen the $75,000 to $76,000 area, where liquidation data show another broad concentration.
Macro risks also stay active after the Federal Reserve raised rates by 25 basis points. The Bank of Japan then increased its benchmark rate to 1.25%. The U.S. Senate also rejected the CLARITY Act, delaying federal crypto market structure legislation.
The lower Bollinger Band stood near $74,948. CoinGlass data showed leveraged positions concentrated between $75,000 and $76,000, adding a liquidity zone below the current range.

