
 Eyes Recovery as Whales Accumulate 250M Tokens and TD Sequential Signals Buy Opportunity")
Key Highlights
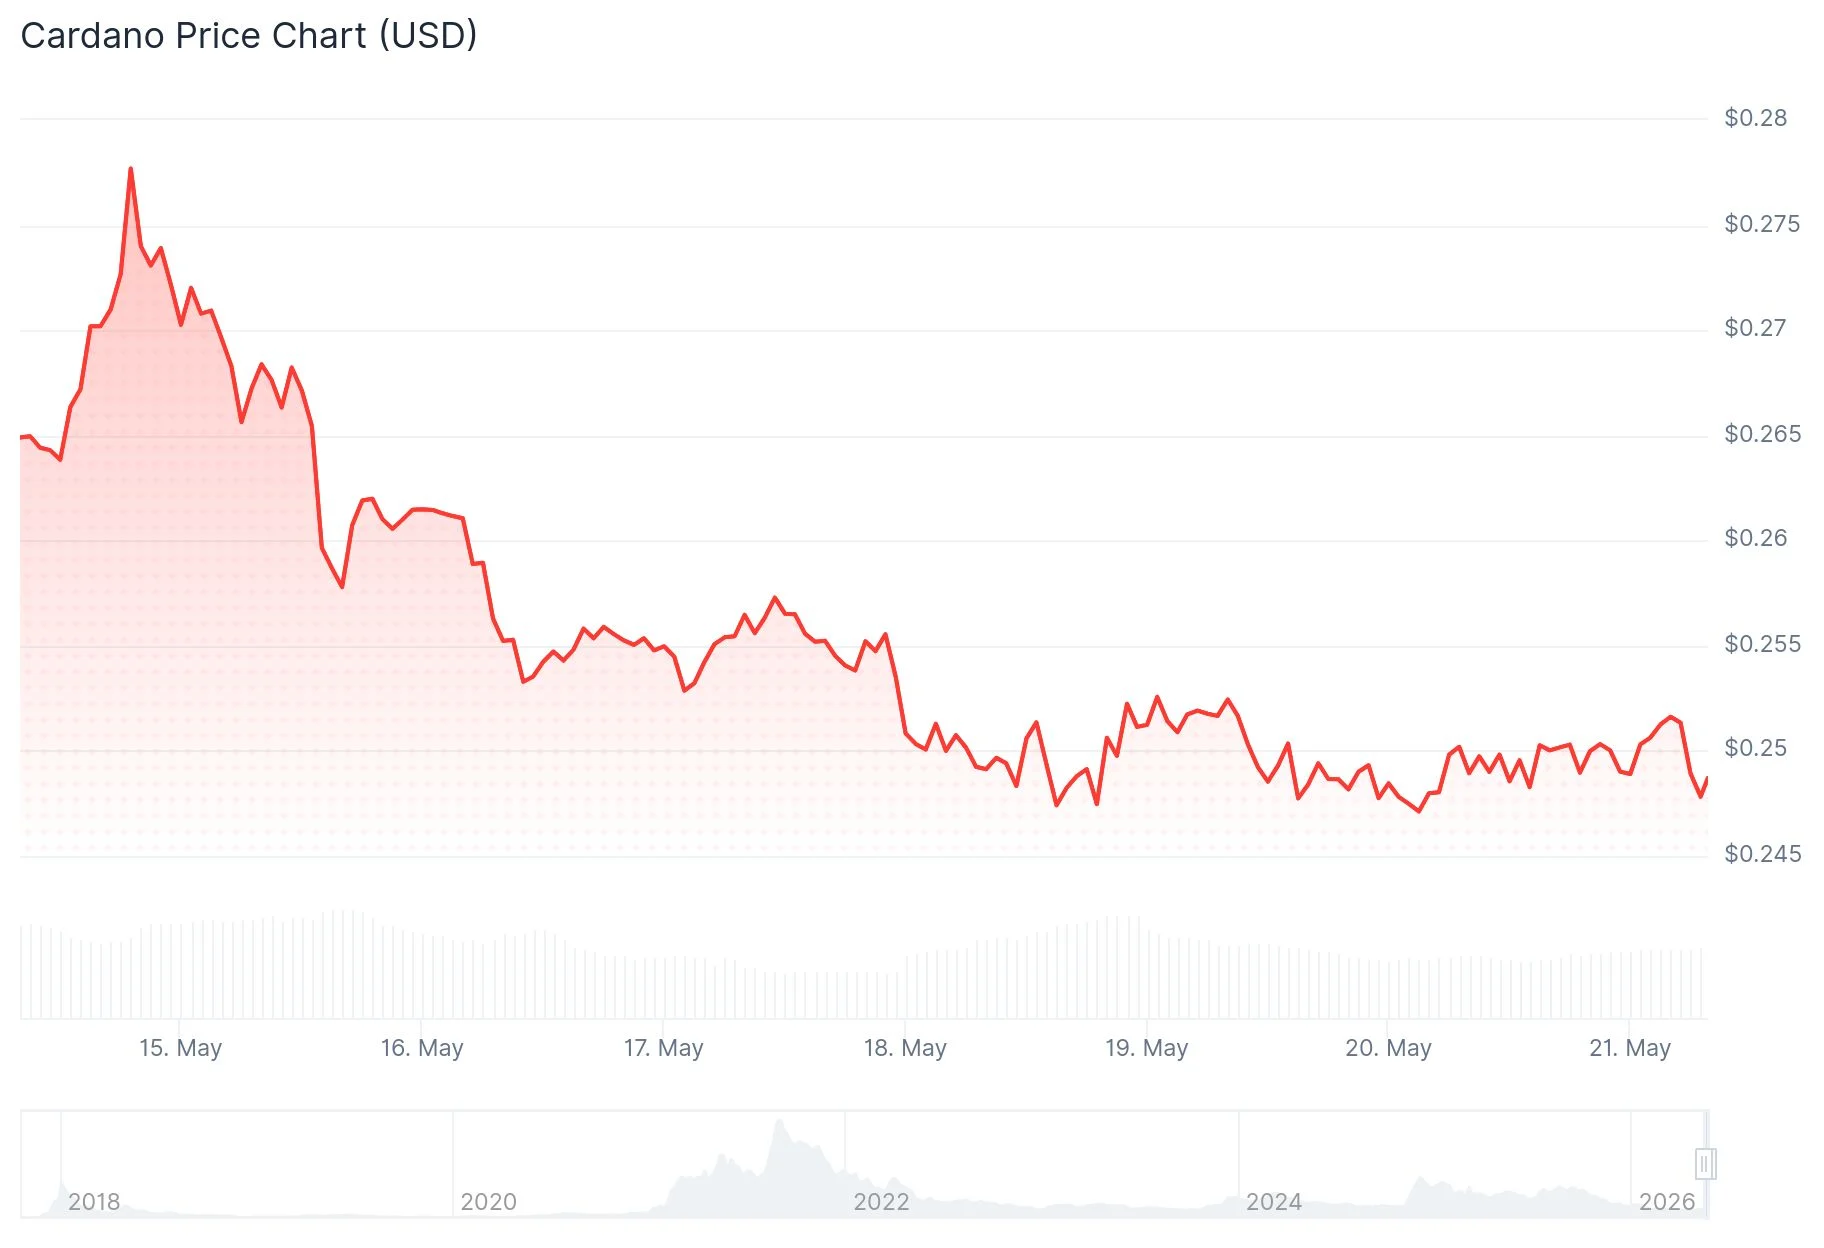
- Cardano currently trades near $0.25 following a five-session decline, showing a modest 0.68% gain on Wednesday.
- Major holders have accumulated approximately 250 million ADA tokens starting May 11, indicating sustained institutional interest.
- Derivatives data shows a long-to-short ratio of 0.80, suggesting bearish positioning dominates short-term trading activity.
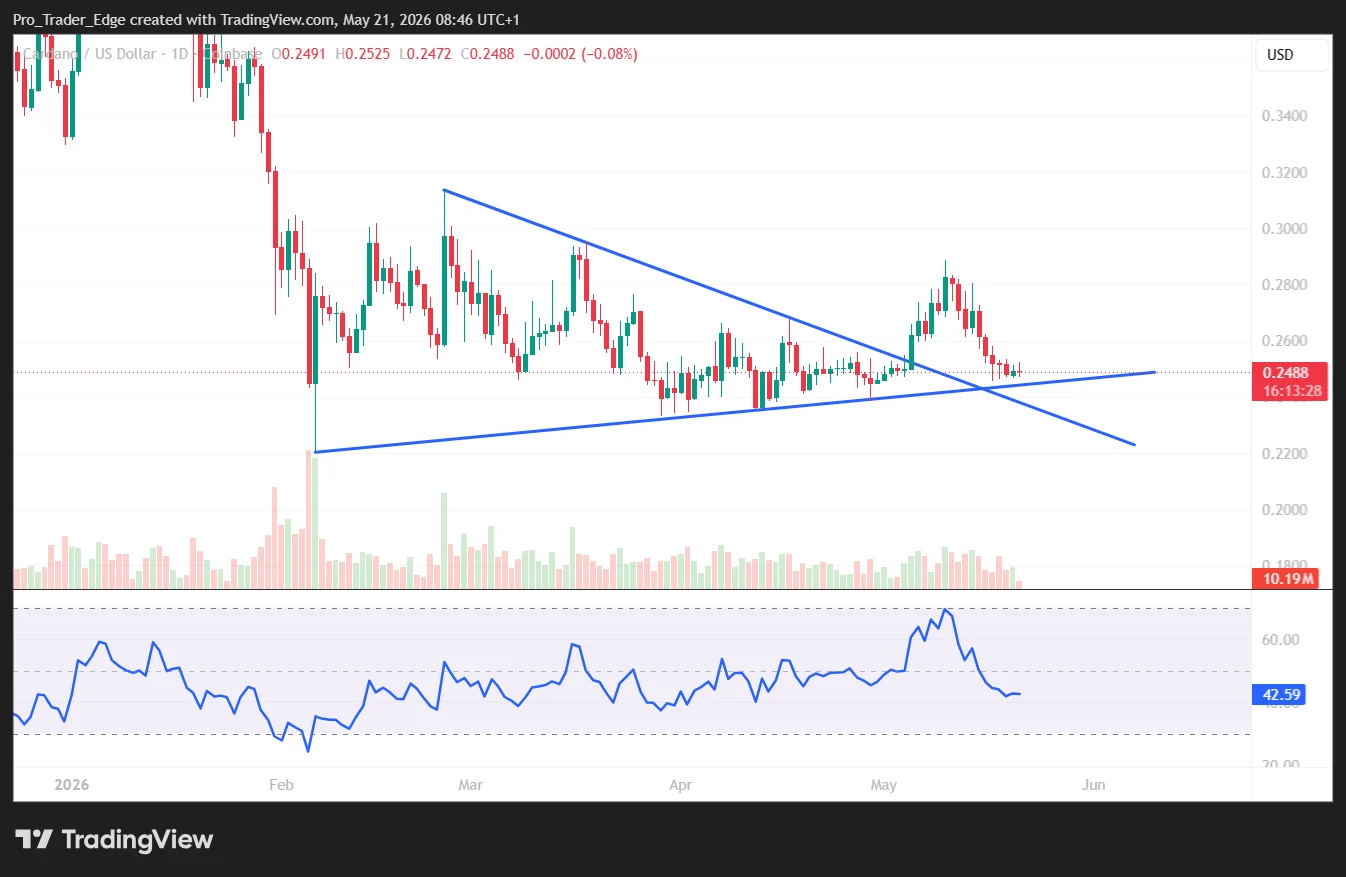
- Price action remains constrained below key exponential moving averages, with RSI at 43 and negative MACD readings.
- Technical analyst Ali Charts identifies a TD Sequential buy setup, projecting an initial bounce toward $0.255 if $0.246 support maintains.
Cardano (ADA) is showing signs of stabilization following a sustained five-day selloff. Currently priced at approximately $0.2499, the asset has gained 0.68% over the last 24 hours. While this represents a minor uptick, the overall technical landscape continues to face headwinds.
Blockchain analytics platform Santiment reveals significant accumulation activity among high-net-worth holders. Addresses containing between 100,000 and 100 million ADA have collectively acquired roughly 250 million tokens since May 11. Such concentrated buying during price weakness typically indicates strong conviction among sophisticated market participants.
Crypto analyst Ali Charts shared via X that the TD Sequential indicator—which successfully predicted the recent 15% decline starting May 10—has now generated a buy signal. According to his analysis, a potential local bottom could be establishing, with the first upside objective at $0.255 and a subsequent target at $0.262. Critically, he emphasized that daily closes must remain above the $0.246 threshold to validate this bullish scenario.
Bearish Technical Indicators Persist
Cardano’s price structure remains compromised below multiple significant exponential moving averages. The 50-day EMA stands at $0.258, the 100-day at $0.280, and the 200-day at $0.355. The Relative Strength Index registers 43, while the MACD continues displaying negative values. These metrics collectively indicate diminished momentum and suggest potential resistance during recovery attempts.
Bollinger Band analysis reveals consolidation activity near the middle band, with price maintaining position above the lower boundary at $0.2393. This configuration prevents immediate structural breakdown but fails to establish bullish momentum.
Critical overhead resistance emerges at the 50-day EMA of $0.258, followed by the 23.6% Fibonacci level at $0.271 and trendline resistance at $0.274. Support zones include $0.245 and $0.236, with a more substantial floor near the February minimum of $0.220.
Real-World Asset Integration Advances
The Cardano Foundation recently released an updated Real-World Asset (RWA) tokenization framework through Cardano Academy. The documentation illustrates methods for tokenizing tangible assets utilizing Cardano’s current technical architecture. This initiative represents part of the ecosystem’s strategic expansion into mainstream blockchain applications.
Derivatives market data presents conflicting signals. CoinGlass reports a long-to-short ratio of 0.80, marking the lowest reading in more than 30 days. Simultaneously, the open interest-weighted funding rate shifted positive Sunday and currently stands at 0.0072%, indicating long position holders are compensating short sellers—a subtle indicator of sentiment stabilization.
The $0.246 support threshold identified by Ali Charts remains the critical level requiring monitoring through upcoming daily closes.

