
 Faces Downward Pressure as Bearish Pattern Emerges")
Key Takeaways
- Dogecoin has declined 4.62% to approximately $0.106, falling beneath critical moving averages
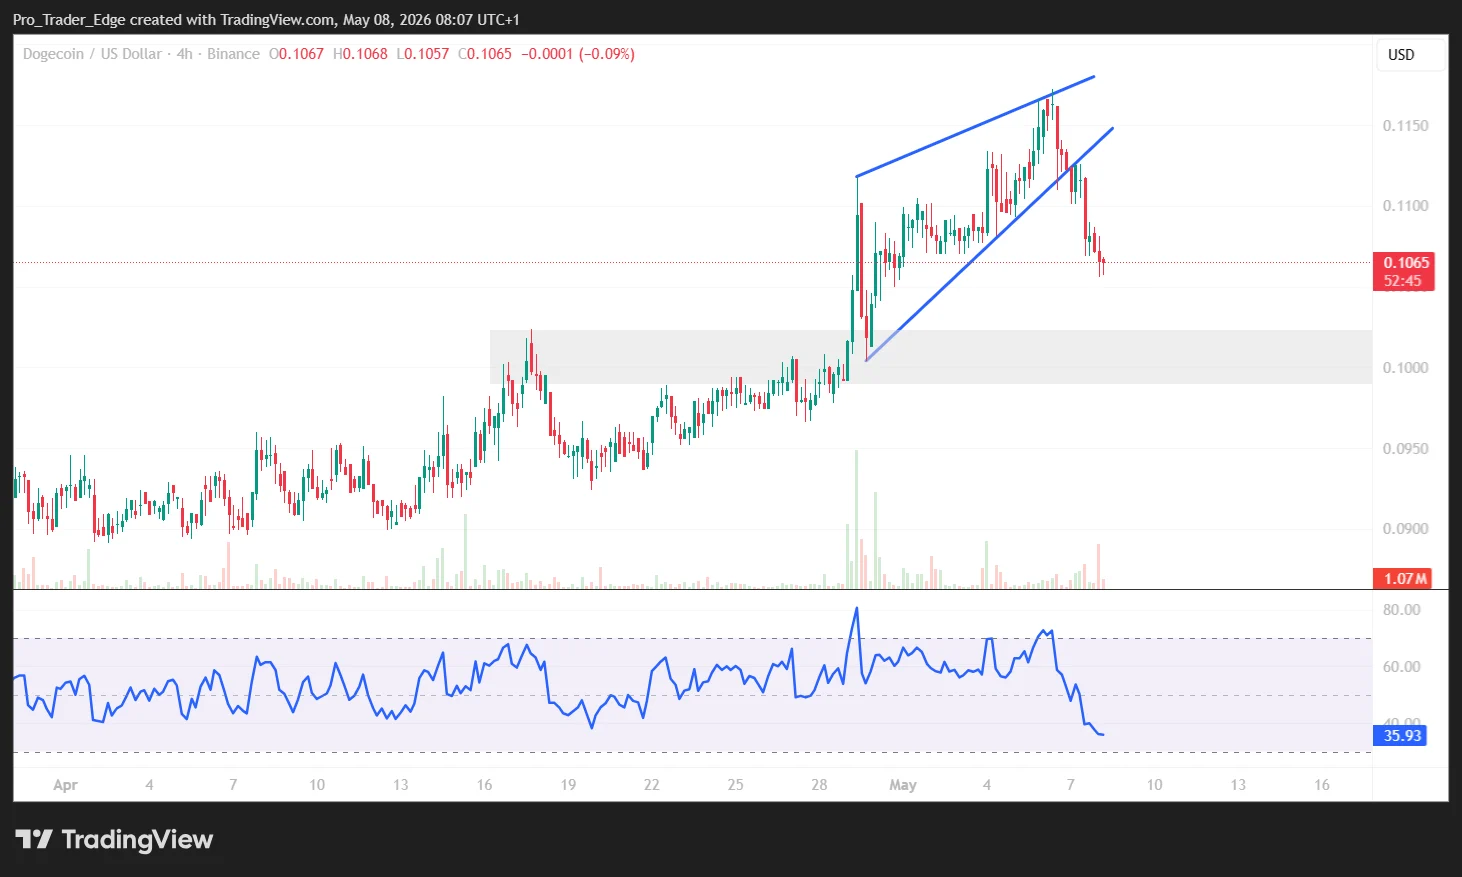
- Technical charts reveal a rising wedge formation indicating potential continued weakness
- Dogecoin ETF activity resumed on May 5–6 with over $600,000 in inflows following a dormant period
- Critical price floor established at $0.10; failure to hold may trigger decline toward $0.088–$0.082
- Overhead resistance barriers identified at $0.1085, $0.1115, and $0.1132
Dogecoin faces mounting selling pressure this week following a decline exceeding 4%, bringing the meme cryptocurrency to approximately $0.106. The asset has breached the $0.110 threshold and fallen below its 100-hour simple moving average, placing bullish traders in a defensive position.
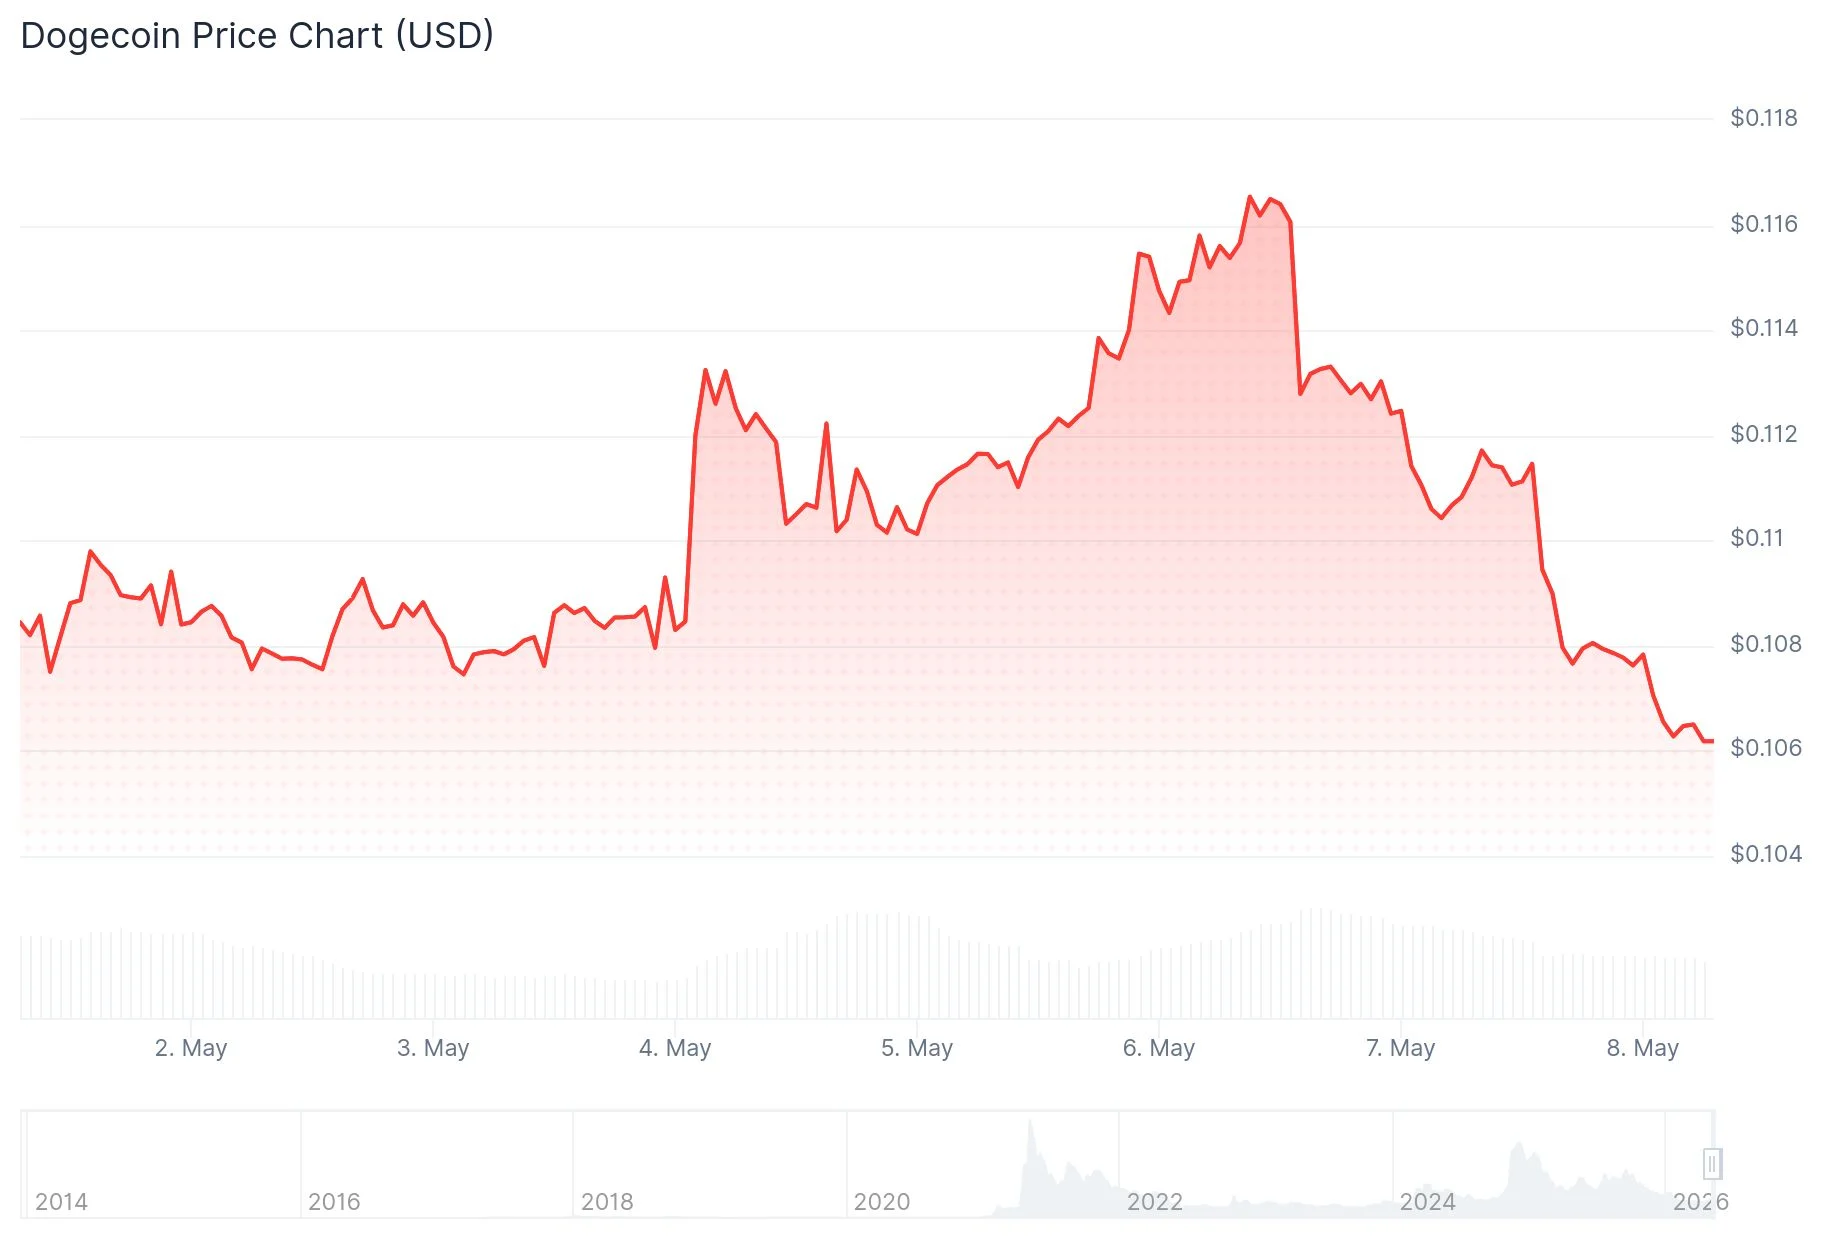
Chart analysis reveals a rising wedge configuration on the 4-hour timeframe. This technical formation typically precedes downward price movements. The pattern indicates DOGE may test the $0.103 level should prices breach the wedge’s lower boundary.
Momentum indicators confirm the bearish sentiment. The Chaikin Money Flow (CMF) alongside the Relative Strength Index (RSI) both display downward trajectories, confirming sellers maintain market control.
Critical Resistance Zones Under Focus
Looking at potential upside movement, DOGE encounters initial resistance at $0.1085, where a downtrend line appears on shorter timeframes. Breaking through this barrier would expose the $0.1115 level, corresponding to the 50% Fibonacci retracement from the recent decline that saw prices fall from $0.1172 to $0.1058.
Should DOGE successfully close above $0.1115, the next price objectives become $0.1132 followed by $0.1145. Breaking decisively through these zones would be necessary for bulls to shift the near-term market structure.
While prices have weakened, Dogecoin exchange-traded funds experienced a resurgence in capital allocation. Following a complete absence of flows from April 28 through May 4, investment activity resumed on May 5 and 6, accumulating more than $600,000.
DOGE ETFs made history upon launching last year as the inaugural meme coin investment vehicle available to traditional finance participants. Unlike Bitcoin ETFs that register consistent daily volume, DOGE ETFs frequently experience extended periods without transaction activity. The recent flow recovery demonstrates persistent institutional appetite despite current price weakness.
Crucial Support Thresholds That May Define Price Direction
The $0.10 mark represents the most significant defensive level. This psychological support zone carries substantial importance for maintaining current structure. A breakdown below $0.10 would likely trigger moves toward $0.088, with $0.082 as the subsequent target.
More immediate support exists at $0.1050, with secondary backing at $0.1020. Market participants will monitor these price points carefully in upcoming trading sessions.
DOGE typically exhibits correlation with Bitcoin price action. Bitcoin’s recent advance to approximately $82,000 may provide underlying support for DOGE should the leading cryptocurrency sustain positive momentum.
The recent price floor materialized near $0.1058, with current trading occurring below the 23.6% Fibonacci retracement level measured from that downward swing.
As of May 8, DOGE trades beneath both $0.1085 and the 100-hour moving average, with sellers maintaining short-term market advantage.

