



Key Takeaways
- DOGE climbs 2.25% to reach $0.073 following US inflation figures showing CPI declining to 3.5%
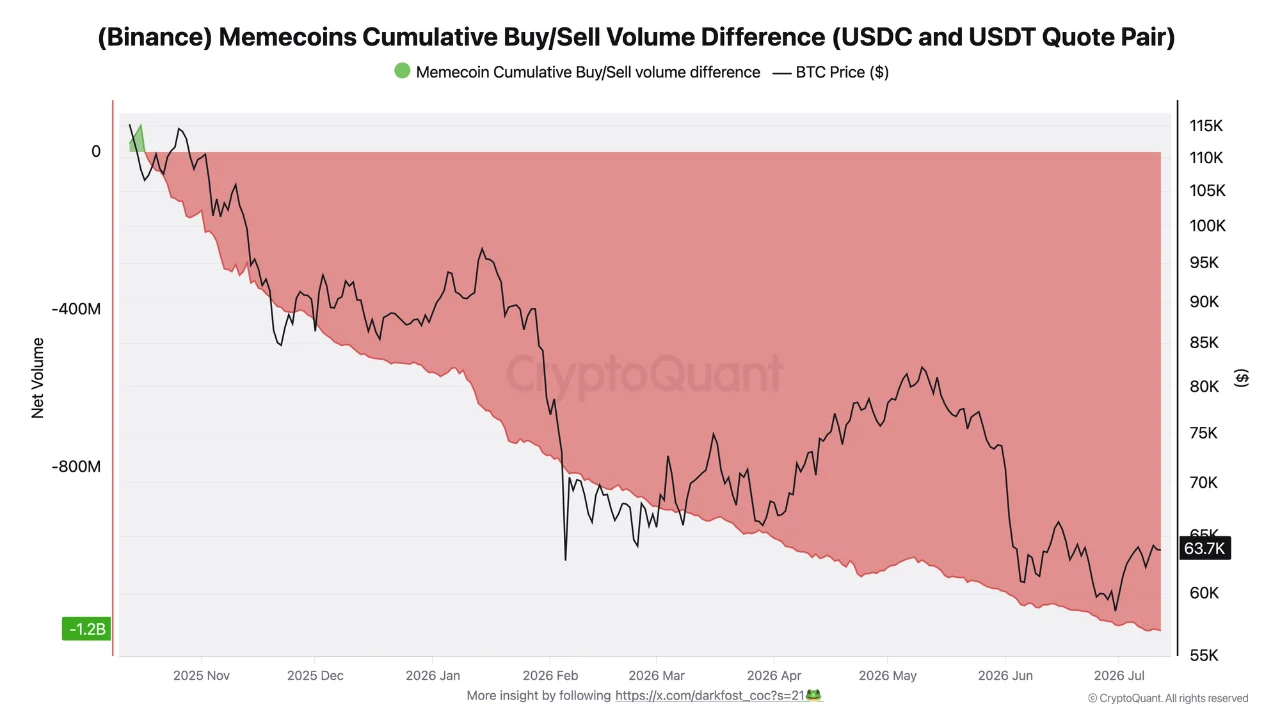
- Meme coin selloff on Binance totals $1.2 billion since October 2025
- Dogecoin has plummeted 73% from its October 2025 peak of $0.26
- ETF products for Dogecoin show zero capital inflows since June 17, holding only $9.9M in total assets
- Critical support level identified at $0.071; breakdown could trigger decline toward $0.068–$0.064 range
Dogecoin has climbed to $0.073 as of July 14, posting a 2.25% daily increase. The modest recovery follows the release of US Consumer Price Index data revealing inflation cooled to 3.5%, providing temporary support for risk-oriented assets.
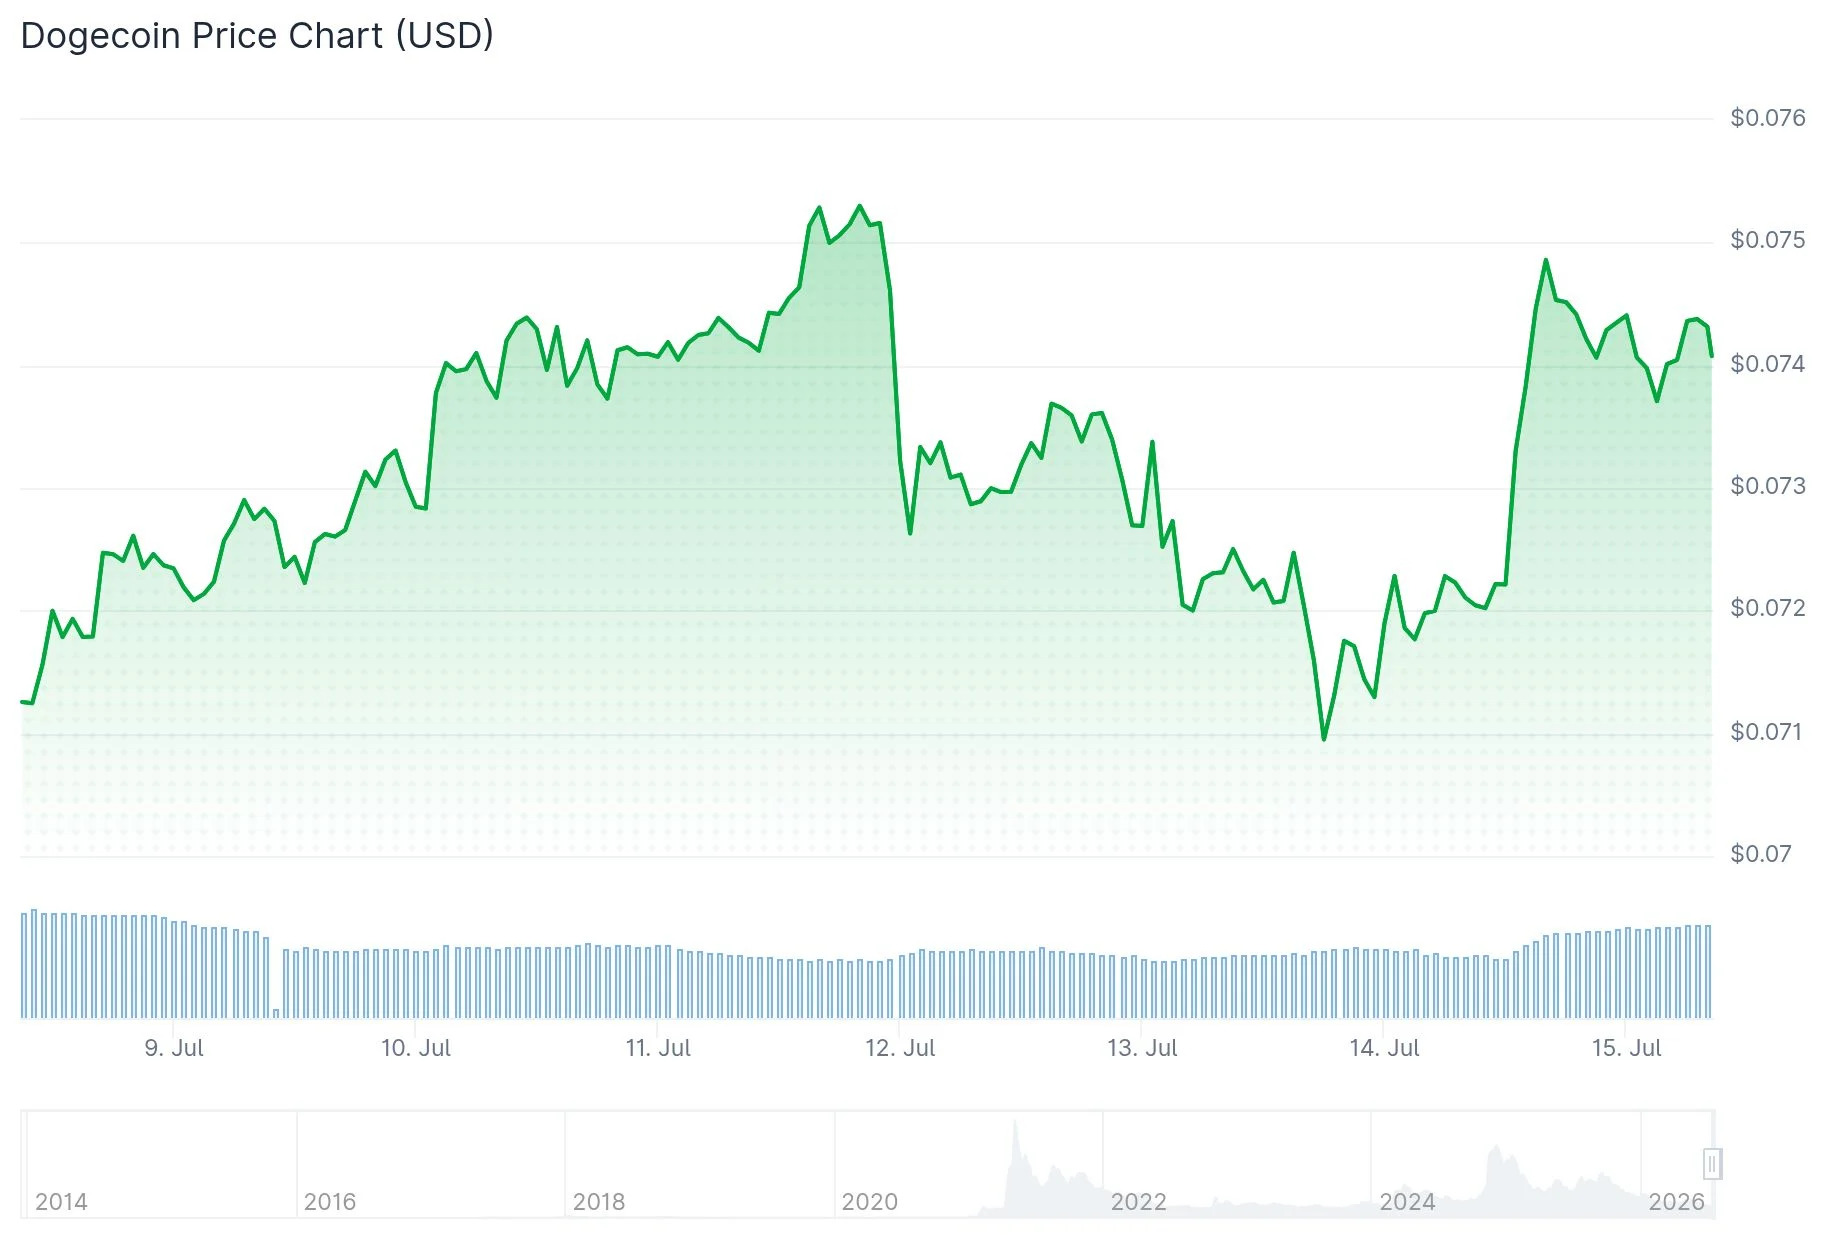
While the token shows short-term strength, the broader trend for DOGE remains deeply negative. The cryptocurrency has collapsed 73% from its October 2025 high near $0.26. During the same timeframe, Bitcoin declined approximately 50%, highlighting DOGE’s substantial underperformance relative to the leading digital asset.
Data from CryptoQuant reveals that Binance users have liquidated $1.2 billion in meme-based cryptocurrencies since October 2025. Market analyst Darkfost characterizes meme coins as the “riskiest assets” within the cryptocurrency ecosystem, cautioning that today’s price increase may prove fleeting without a significant return of sustained buying activity.
Market commentator Kamran Asghar highlighted on X that $DOGE maintains a crucial weekly accumulation zone around $0.07, where previous cycle lows have established themselves, suggesting the possibility remains for a macro-level recovery toward elevated price objectives.
Chart Analysis Points to Continued Weakness
DOGE currently trades beneath its 200-day, 100-day, and 50-day exponential moving averages. The Relative Strength Index registers at 41, remaining in bearish territory despite showing upward momentum. Should the RSI breach the 50 level, momentum could shift favorably and drive prices toward the 50-day EMA positioned at $0.082.
Examining the daily timeframe, DOGE has violated the $0.0715 support threshold following an unsuccessful recovery effort near $0.078. Should the closing price settle below $0.0715, technical analysts are monitoring $0.068 and the $0.064–$0.066 area as subsequent downside destinations.
A potential double-bottom formation is developing on the daily chart provided DOGE maintains the $0.071 support floor. If this pattern materializes, the initial objective stands at the July 4 peak of $0.079, with a secondary target representing a 10% advance to $0.087.
Analyst Trader Tardigrade references the monthly timeframe, suggesting the 2021–2026 pattern resembles the 2014–2017 cycle, which preceded Dogecoin’s substantial 2017–2021 bull run. The chart displays a descending wedge formation that could indicate a longer-duration trend reversal if DOGE achieves a breakout and sustains the movement.
Investment Product Interest and Derivatives Activity Decline
Dogecoin exchange-traded fund products have registered zero capital inflows since June 17. These investment vehicles have experienced no activity for six straight trading sessions beginning July 2 and maintain merely $9.9 million in aggregate net assets — representing 0.09% of DOGE’s complete market capitalization.
Open interest has contracted from $1.76 billion in May 2026 to $1 billion as of July 14. The long-to-short position ratio has declined to 0.88 according to CoinGlass analytics, indicating more market participants are betting on additional downside rather than upward price movement.
The introduction of Robinhood Chain on July 1 has generated renewed attention in select meme cryptocurrencies, with its native token CASHCAT achieving a $138 million market valuation since its debut.

