
 Price: 4.5% Surge Faces Skepticism as Fakeout Signals Emerge")
Key Takeaways
- Dogecoin hovers around $0.09, locked in a narrow consolidation pattern without clear directional momentum.
- Technical indicators show neutral conditions with RSI at 46.30 and a flattening MACD histogram.
- DOGE rallied 4.5% in recent sessions, briefly approaching $0.10 and outpacing Bitcoin and Ethereum gains.
- Market data suggests the price action stems from derivatives activity and leverage rather than genuine network usage.
- Technical analyst Ali Charts identified a false breakout pattern on the 12-hour timeframe, forecasting a potential pullback to $0.088.
Dogecoin has positioned itself near the $0.09 mark following a notable 4.5% price increase that temporarily brought the memecoin within striking distance of the $0.10 psychological level. This upward movement allowed DOGE to outshine both Bitcoin and Ethereum during the trading session as investors rotated capital into more speculative cryptocurrency positions.
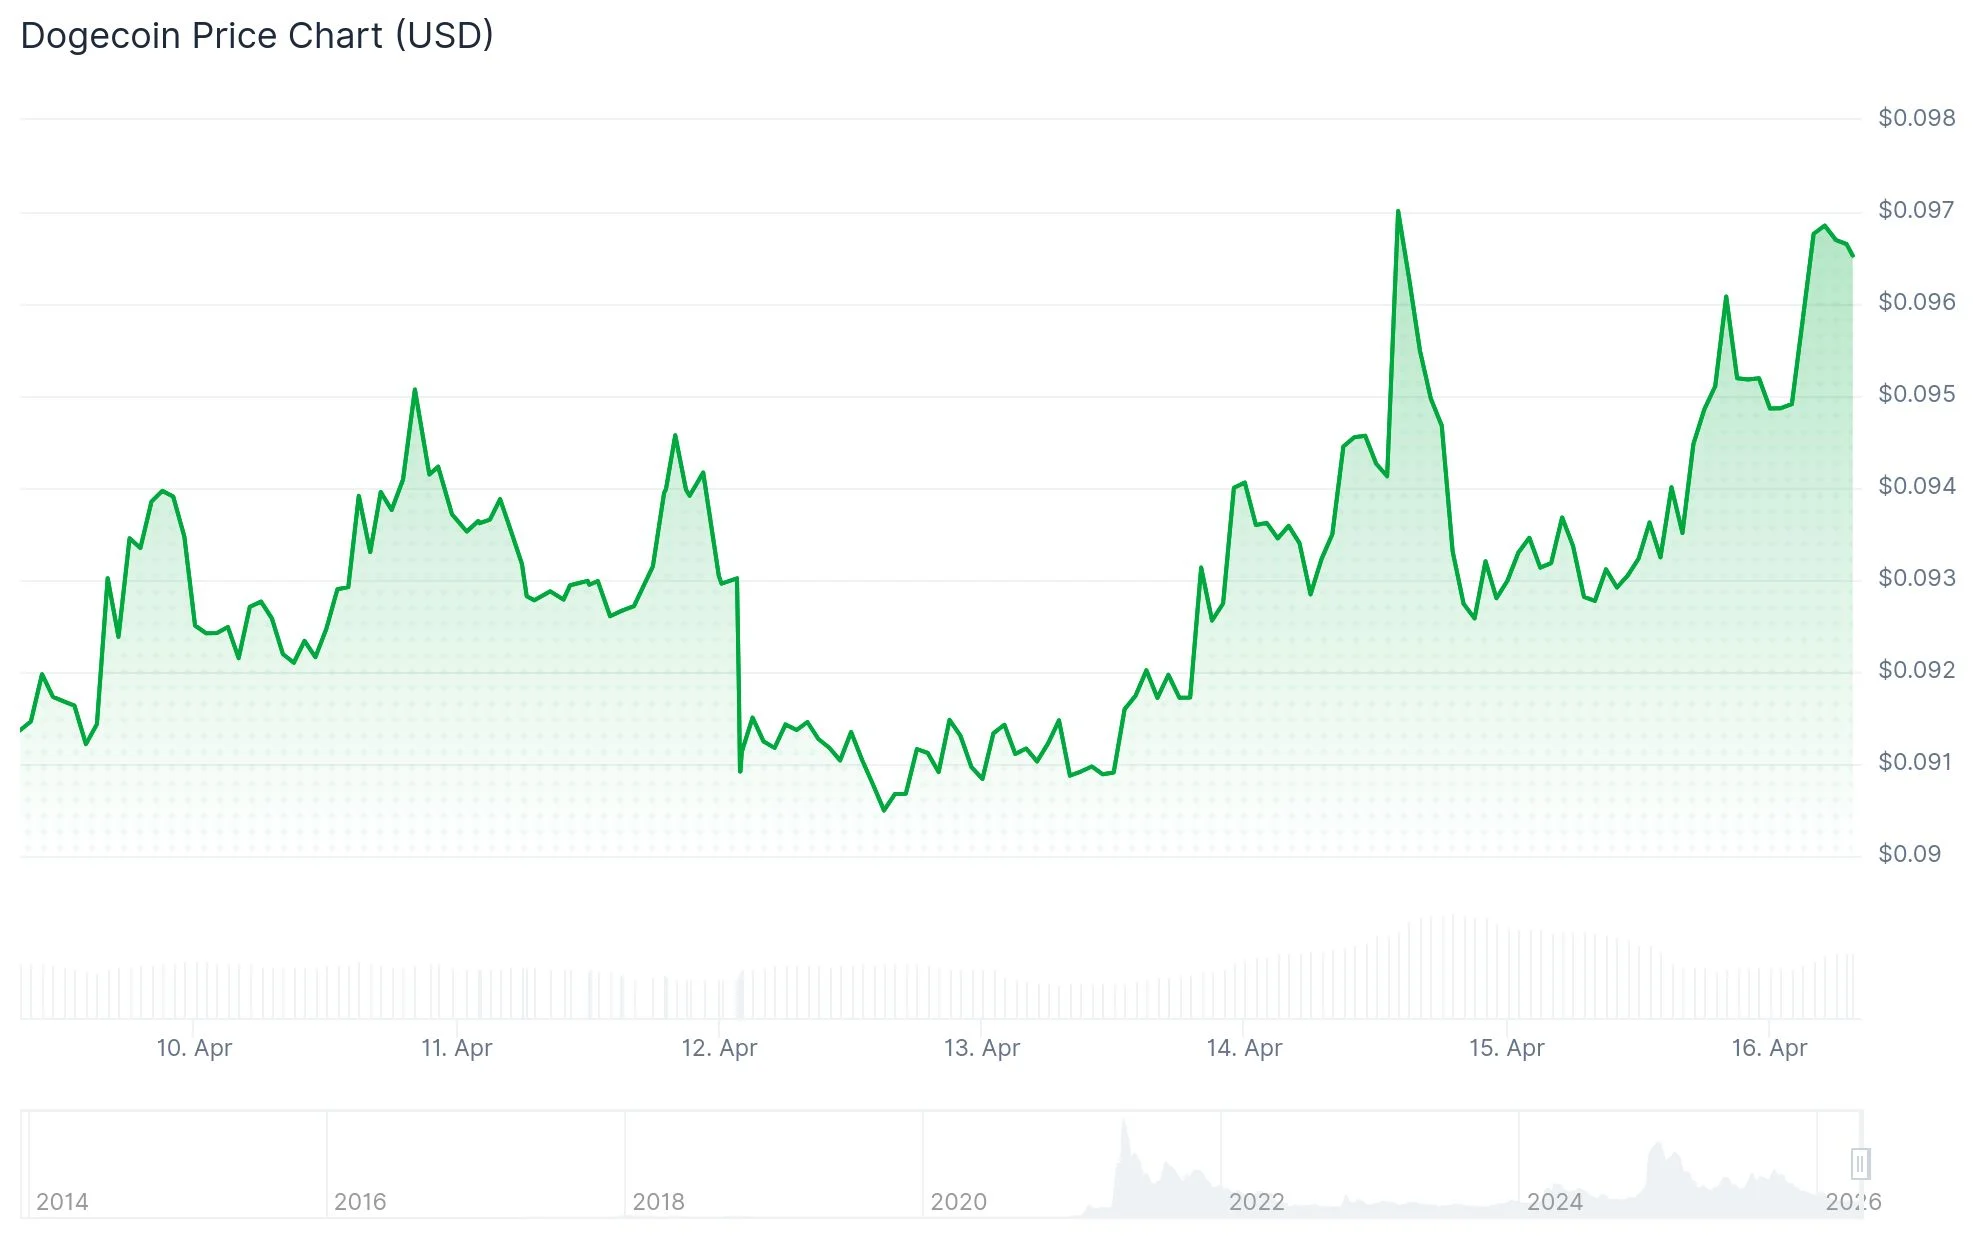
The price surge carried DOGE from the $0.093 level up to $0.098, successfully penetrating the $0.095 resistance barrier with substantial trading volume. The asset constructed a pattern of progressively higher lows before experiencing a sharp acceleration during the final trading hour.
However, blockchain metrics tell a different story. Network activity indicators show declining daily active addresses, indicating the price movement likely stems from futures market positioning and leveraged trades rather than authentic user demand or organic adoption.
Late-session buying pressure patterns suggested institutional participation, especially during the push past the $0.097 threshold. Volume analysis confirmed genuine market engagement rather than price movements driven by shallow liquidity pools.
Technical Analyst Flags False Breakout Pattern
Prominent cryptocurrency analyst Ali Charts identified a textbook fakeout formation on Dogecoin’s 12-hour chart. DOGE attempted to breach a descending triangle pattern, but the upper trendline proved insurmountable, acting as firm resistance and immediately pushing price back down.
Ali Charts emphasized that when breakout attempts fail with such conviction, markets typically seek liquidity at the lower boundary of the trading structure. The analyst specifically highlighted $0.088 as the probable retest destination, describing it as “the definitive line in the sand” for Dogecoin’s near-term price action.
The Relative Strength Index currently registers 46.30, indicating equilibrium between buying and selling forces. Meanwhile, the MACD histogram displays a flat configuration, signaling that downward momentum has decelerated without transitioning into bullish territory.
Critical Price Levels Under Observation
Bollinger Band analysis reveals DOGE trading nearer to the lower band around $0.09, while the upper band near $0.10 maintains its role as overhead resistance.
Several short-term and intermediate moving averages converge around the $0.09 zone, strengthening its significance as a support level. DOGE continues trading substantially beneath its long-term moving average positioned near $0.14, underscoring the prevailing bearish market architecture.
Market participants are monitoring $0.096 as immediate support. Maintaining price action above this threshold preserves the validity of the current breakout scenario.
The $0.104 level represents crucial resistance territory. A decisive move above this price point would signal a more convincing bullish structural shift. Conversely, a decline below the $0.092–$0.090 range would likely trigger a more substantial correction.
The overall market structure continues to reflect compression beneath descending resistance lines rather than a validated trend reversal pattern.

