



Key Takeaways
- Friday saw Ethereum ETFs experience $70.62 million in net withdrawals, terminating a consecutive five-day period of capital inflows
- Weekly performance remained positive with $103.9 million in net ETF inflows for ETH, marking the third straight week of gains
- The ETH/BTC ratio fell to 0.028, marking its weakest position since August of the previous year
- Blockchain metrics indicate ETH is currently valued beneath its collective cost basis of $2,304, a condition that typically depletes selling pressure
- Critical bottom indicators including MVRV and exchange deposit volumes haven’t achieved the extreme thresholds that typically signal a definitive price floor
Ethereum (ETH) concluded the trading week at $1,837 following net outflows of $70.62 million from US-based spot Ethereum ETFs on Friday, July 25. This marked the end of a consecutive five-day period of positive inflows that had accumulated $211.25 million between July 17 and July 24.
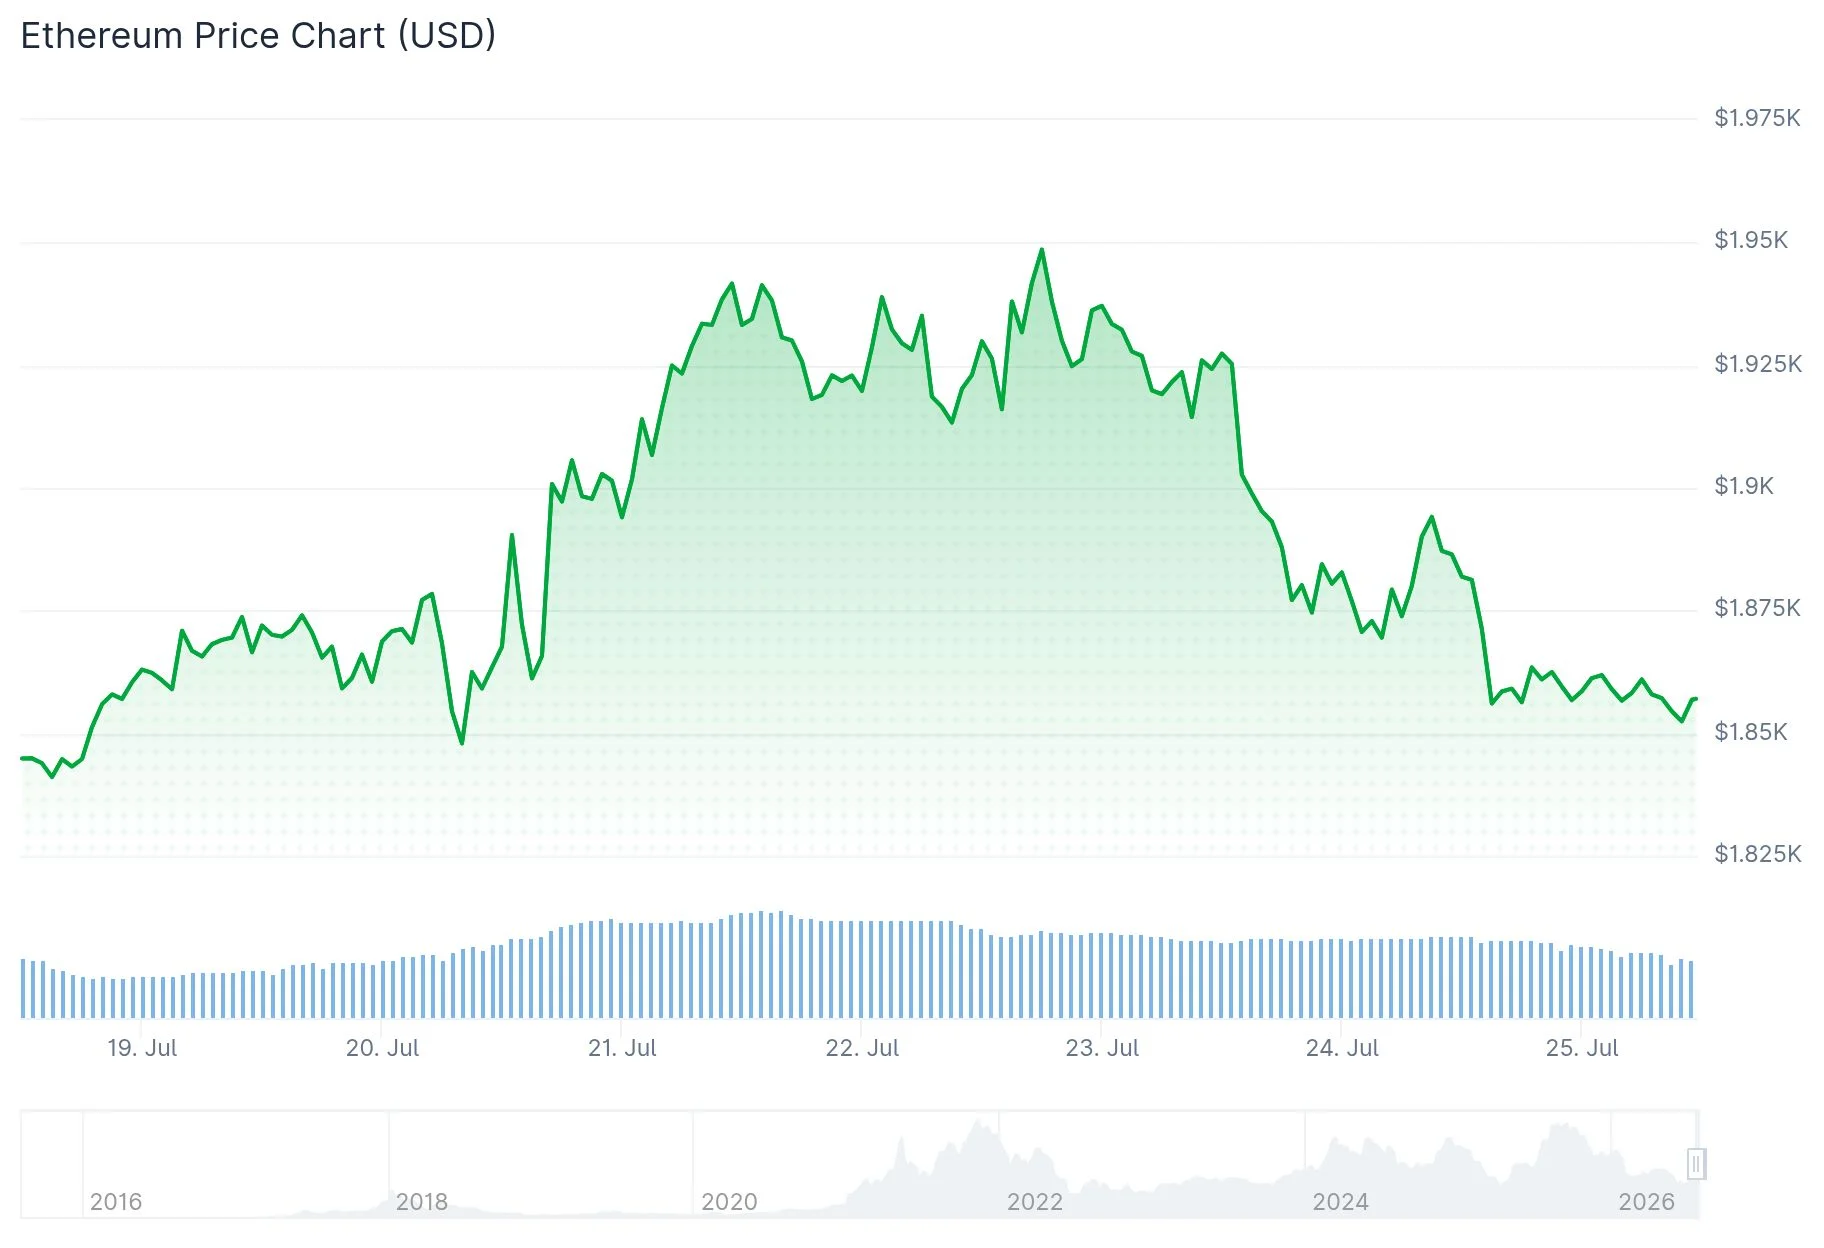
While Friday’s data showed a reversal, the broader weekly picture remained positive with Ethereum ETFs securing $103.9 million in aggregate net inflows. This performance marked the third successive week of positive capital movement. Throughout July, ETH ETFs have accumulated total inflows reaching $337.74 million.
Bitcoin ETFs demonstrated a comparable trajectory, registering $240.08 million in net withdrawals on Friday, concluding a seven-day streak of inflows. BTC hovered slightly below $64,000, retreating from Tuesday’s weekly peak of $66,892.
Market analyst Ted (@TedPillows) commented via social media that ETH continues to maintain its position above critical support levels. He observed that Ethereum is demonstrating relative strength versus Bitcoin and suggested the current upward movement may have additional momentum remaining.
ETH has experienced a significant decline from its record peak of $4,946 established last year, reaching as low as $1,400 in June before staging a recovery. The cryptocurrency currently trades approximately 17% beneath its realized price—the mean on-chain acquisition cost for all ETH tokens—which stands at $2,304.
Examining ETH Bottom Formation: The On-Chain Evidence
A CryptoQuant analysis published Thursday indicates Ethereum is displaying preliminary indications of a market floor formation, though it hasn’t satisfied all criteria necessary to confirm a durable upward trend.
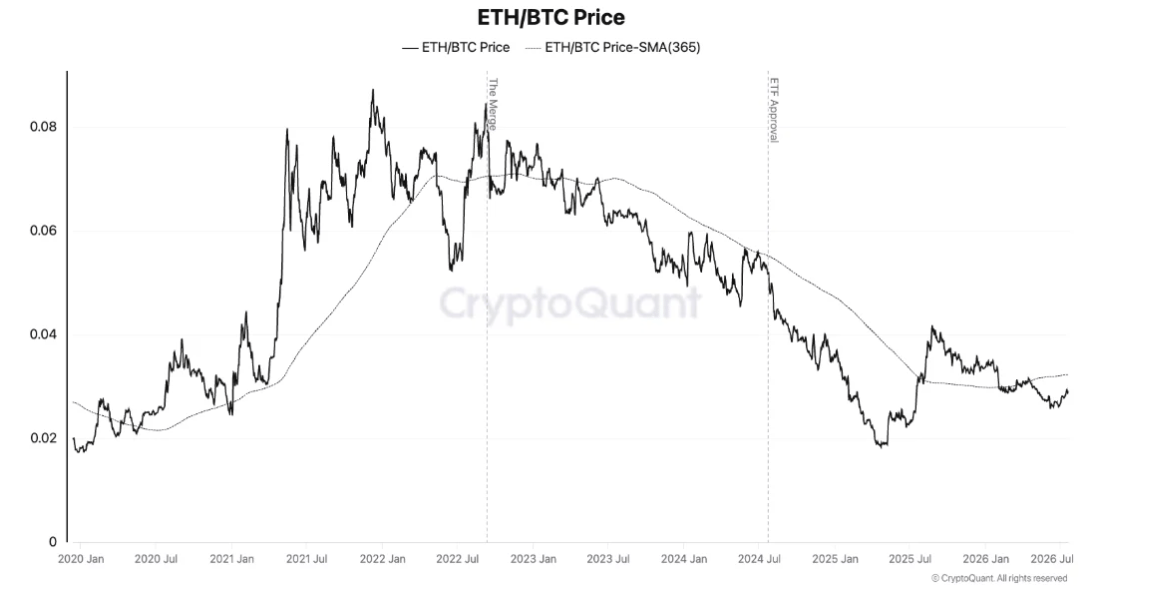
The ETH/BTC ratio has contracted to 0.028, representing its weakest reading since August of last year. While this degree of underperformance relative to Bitcoin has historically preceded significant altcoin rallies, market observers emphasize that additional confirmation remains necessary.
The ETH/BTC MVRV ratio has decreased from 0.95 last August to approximately 0.65. According to CryptoQuant’s research, a reliable bottom formation typically materializes when this metric falls beneath 0.45, a threshold observed during 2019-20 and early 2025.
Critical Technical Price Levels for ETH
Ethereum is presently challenging its 20-day and 50-day Exponential Moving Averages (EMAs) positioned at $1,839 and $1,831 respectively. A decisive move below these technical indicators could reveal support zones near $1,806, followed by $1,741.
ETH witnessed $67.79 million in liquidations throughout the previous 24-hour period, with long position liquidations accounting for $44.18 million of that total.
However, one indicator is currently suggesting bottom formation. The ETH/BTC relative spot trading volume has contracted from 1.75 in August to approximately 0.5, a threshold that has historically coincided with Ethereum price bottoms.
Institutional ETF demand has also shown signs of shifting, with the ETH/BTC ETF holdings ratio climbing to 0.13 in July following a decline to 0.115 in June.

