
 Price Breaks Above Break-Even Point as Technical Patterns Signal $3,000 Rally")
Key Takeaways
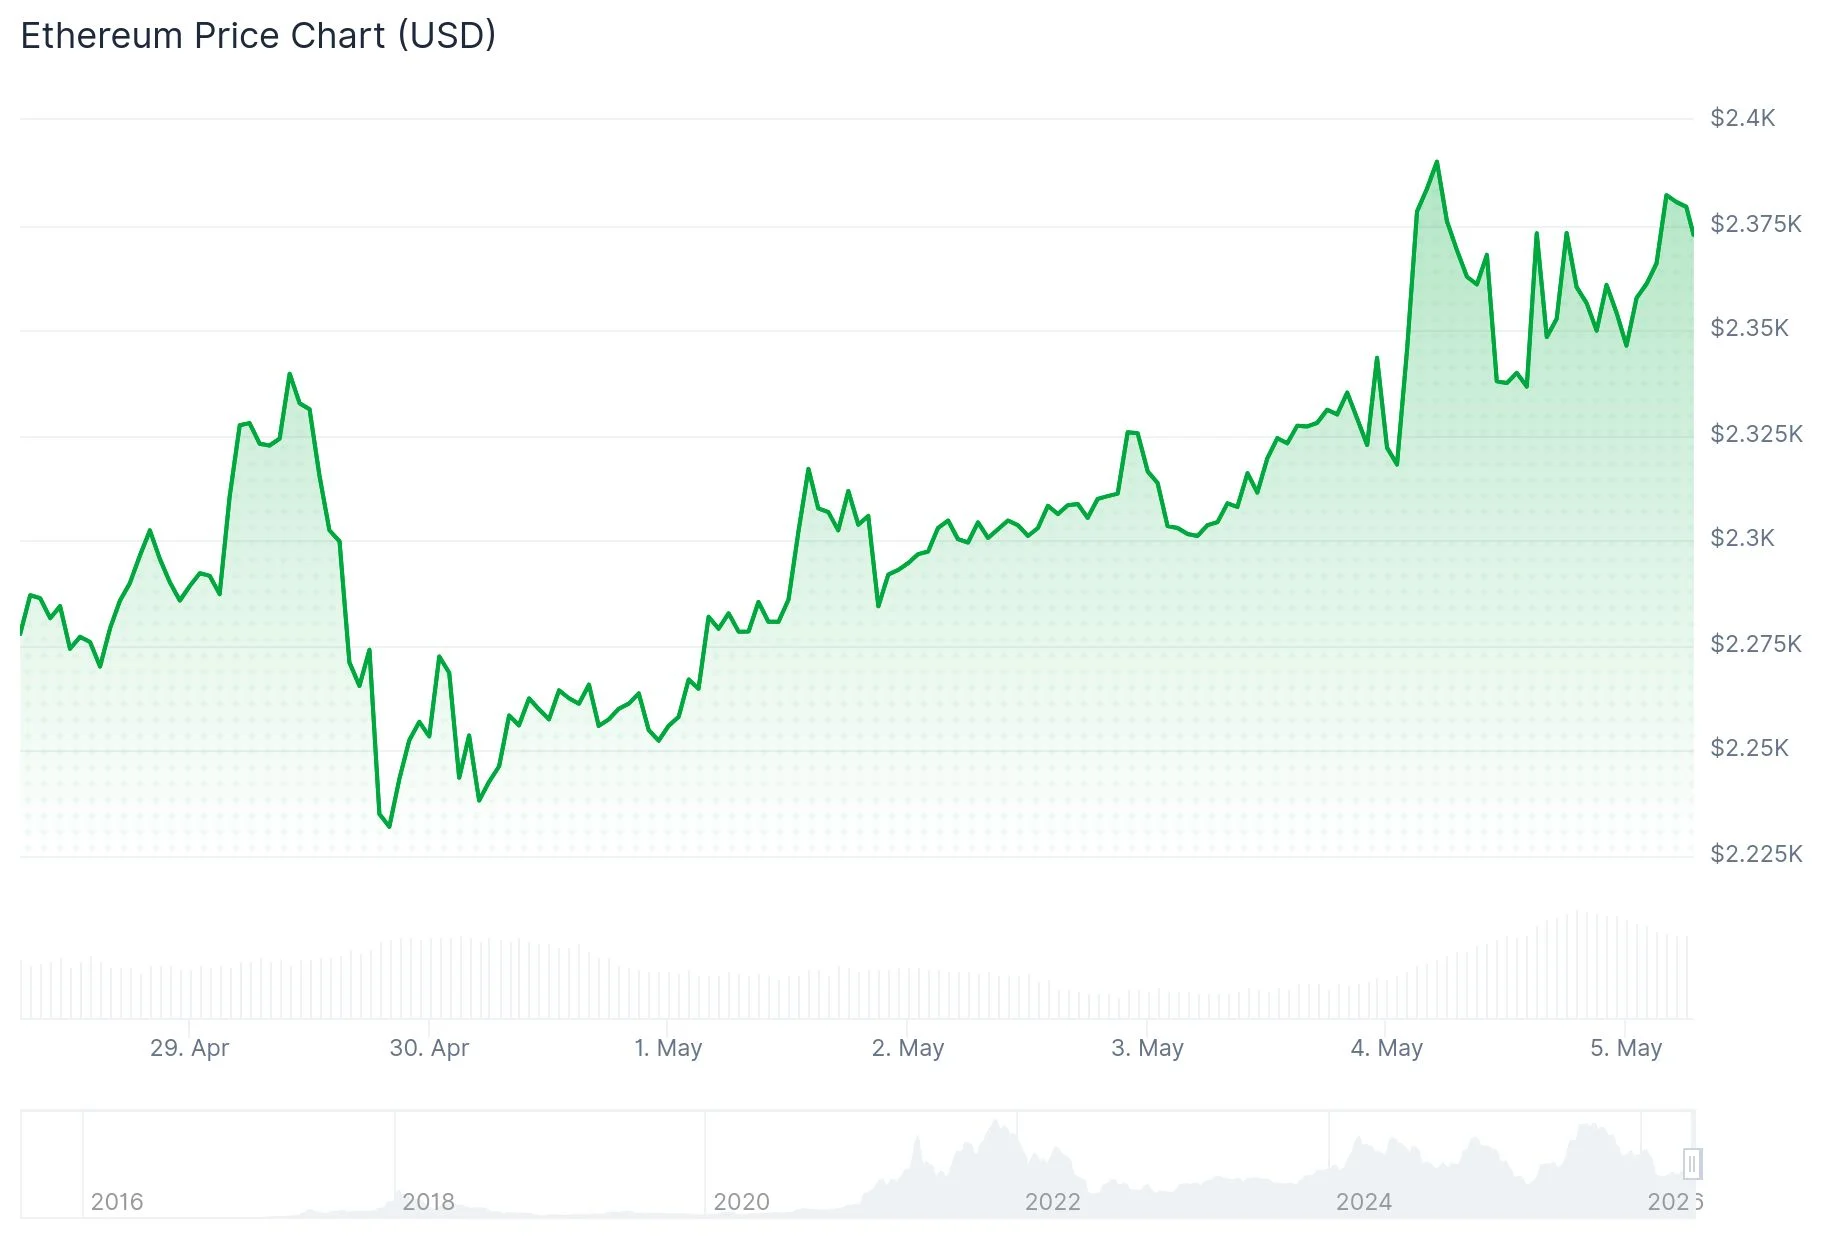
- Ethereum rallied to $2,390, breaking above the $2,320 realized price level, indicating average investors are now profitable
- Technical analysts identify a bull flag formation on daily timeframes with a projected target of $3,018
- Crypto analyst Dami-Defi predicts a breakthrough above $2,400 could spark an aggressive rally toward $2,800–$3,000
- A significant concentration of 7.1 million ETH exists in the $2,750–$2,850 range, presenting a formidable resistance zone
- The Relative Strength Index has rebounded to 56 after touching near-oversold territory at 36 in March
Ethereum has successfully reclaimed the critical $2,320 realized price threshold, marking a pivotal shift that brings the average ETH investor back into positive territory. The cryptocurrency peaked at $2,398 before experiencing a minor retracement to approximately $2,376, representing a 2.2% increase over the previous 24-hour period with trading volume reaching $24.23 billion.
The realized price metric represents the aggregate cost basis of all ETH tokens that have moved across the blockchain network. Historical data demonstrates that trading above this benchmark typically catalyzes a sentiment transformation from bearish caution to bullish optimism.
When Ethereum recaptured this threshold in May 2025, it subsequently delivered an impressive 173% surge, reaching its peak of $4,950. A comparable scenario in early 2023 resulted in a 58% appreciation following the reclaim.
Market analyst Dami-Defi shared insights on X, suggesting that a decisive breakthrough above the $2,400–$2,600 corridor would initiate the “most violent move of the year” in the direction of $3,000, declaring: “Once we break $2,400 we will catapult violently to $2,800–$3,000.” The analyst’s commentary emphasized a substantial momentum zone developing on weekly charts.
Technical Pattern Signals $3,018 Price Objective
On daily chart intervals, Ethereum has developed a textbook bull flag configuration. The asset is presently challenging the $2,350 resistance level, where the flag’s upper boundary intersects with the 100-day exponential moving average.
A confirmed daily candle closure above this critical juncture would activate a calculated price objective of $3,018. Technical analyst Cohelson David separately recognized a broadening wedge pattern on 12-hour timeframes, also projecting movement toward the $3,000 mark.
The Relative Strength Index has climbed to 56 from previously oversold conditions at 36 during late March, demonstrating renewed buying pressure entering the market.
Substantial Resistance Emerges Near $2,800
Notwithstanding the constructive technical picture, a considerable barrier exists within the $2,750 to $2,850 price band. Approximately 7.1 million ETH tokens were accumulated at average costs within this range, establishing a zone where numerous investors may consider liquidating positions at break-even levels.
Cryptocurrency analyst Crypto Patel emphasized $2,400, $2,700, and $3,000 as critical upside thresholds warranting close observation. He cautioned that inability to penetrate the $2,400 barrier could prompt a retreat toward $2,000 support.
The MACD indicator currently registers at 25.03, positioned beneath the signal line at 32.00, with the histogram displaying -6.97, indicating momentum may be experiencing slight deterioration in the near term.
Immediate support is established at $2,323, with additional foundational levels identified at $2,219 and $2,179. Ethereum’s market capitalization currently stands at $282.39 billion.
ETH maintains trading above the $2,360 level and the 100-hour simple moving average, with a constructive trend line providing support at $2,350 on hourly chart structures.

