



Key Takeaways
- Ethereum declined 2.84% to approximately $2,670 on September 23 following resistance rejection near $2,789
- Intraday price action bottomed at $2,648, with crucial support zones identified at $2,626 and $2,550
- Derivative open interest maintained levels around 13 million ETH, indicating restrained leverage deployment
- Spot Ethereum ETFs in the United States attracted $432.2 million across two trading sessions (September 21–22)
- The cryptocurrency holds above critical longer-duration moving averages despite near-term weakness
On September 23, Ethereum experienced a pullback beneath the $2,700 threshold after encountering selling pressure at the $2,800 mark. The cryptocurrency touched a session bottom at $2,648 before finding equilibrium around the $2,670 zone.
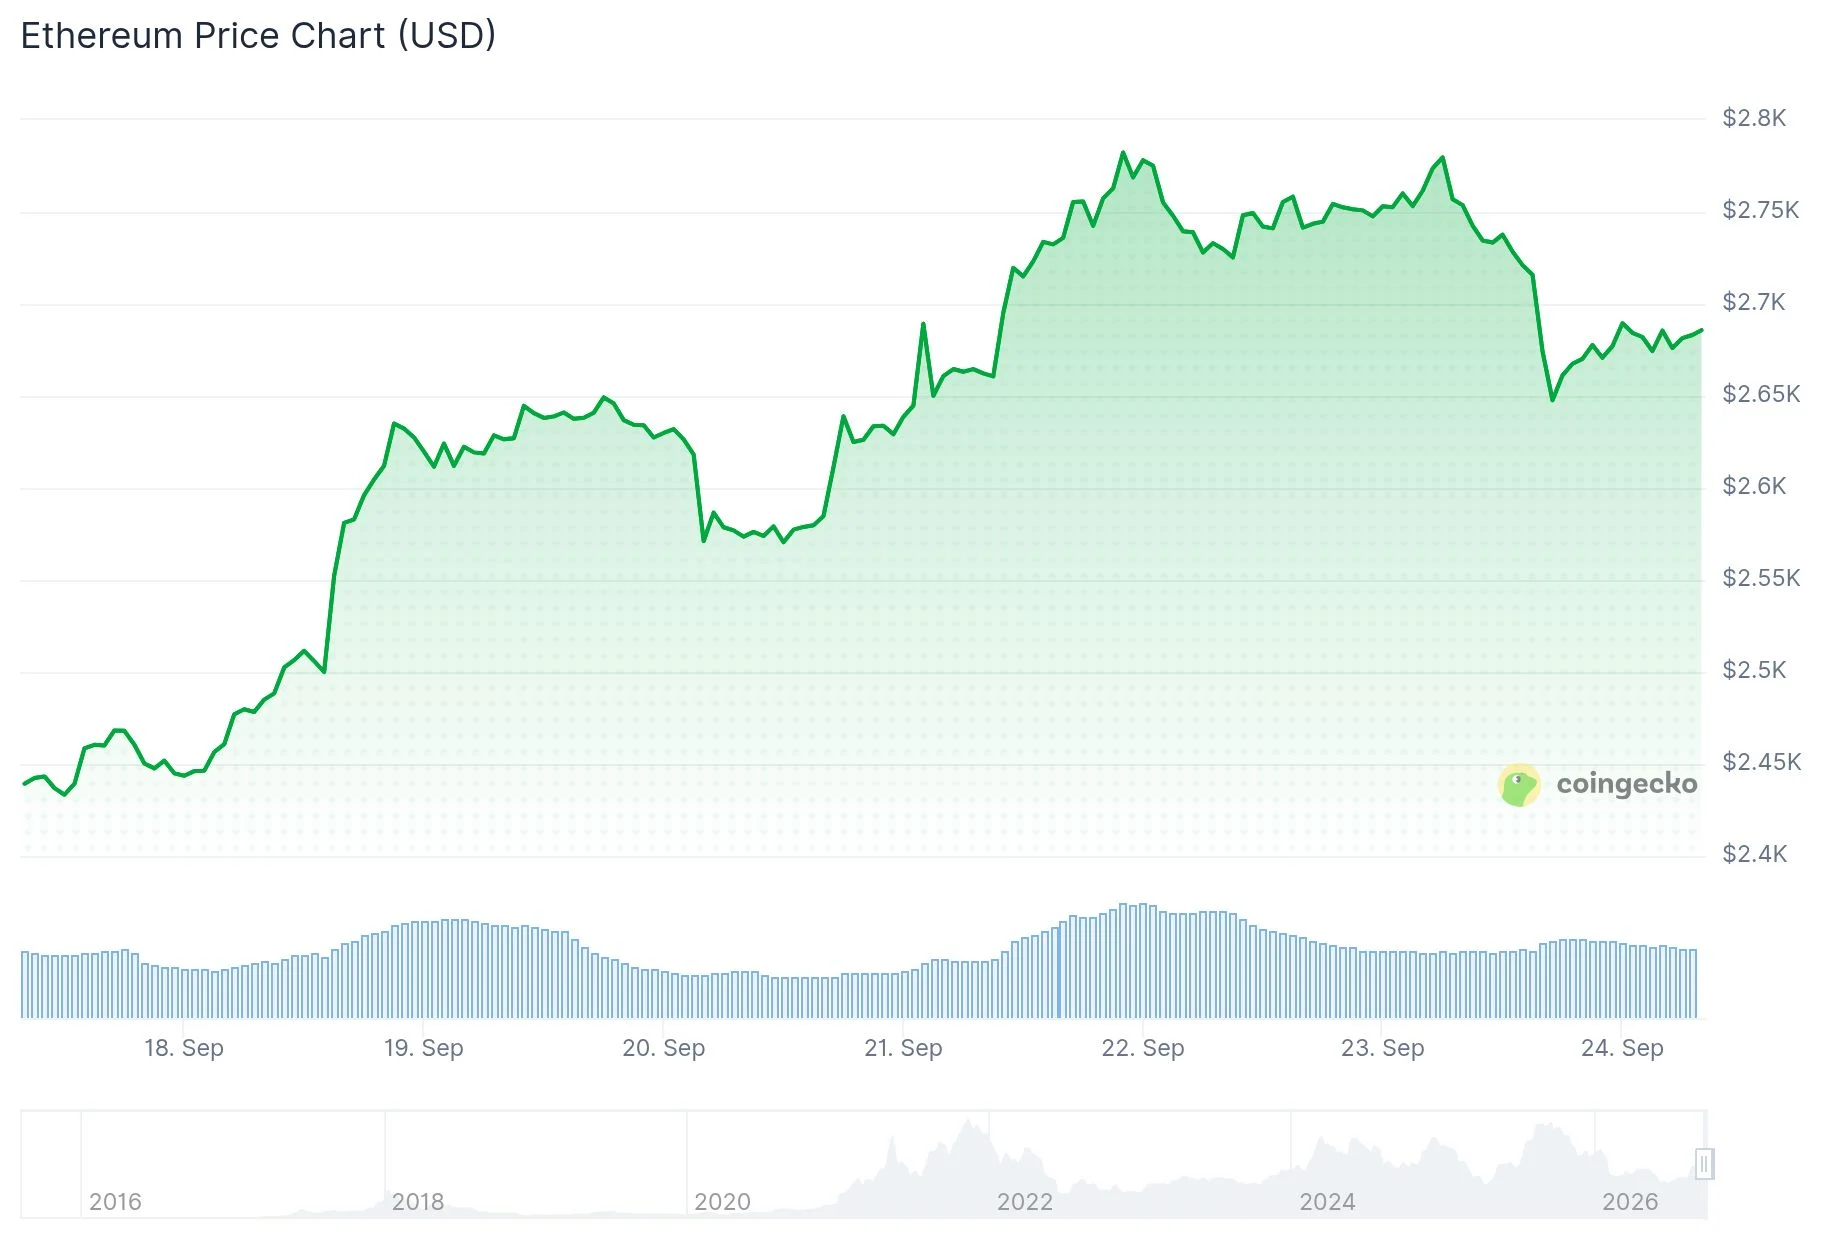
This downturn reversed an upward trajectory that commenced during mid-September from the $2,400 region. ETH successfully breached previous resistance at $2,550 and advanced toward $2,789 before encountering substantial selling activity.
The trading session began with ETH positioned near $2,754, eventually reaching an intraday peak around $2,789. Rejection materialized swiftly, with the asset declining through its near-term moving average positioned at $2,710.
Notwithstanding the decline, ETH continues trading above its 4-hour 50-, 100-, and 200-period moving averages, currently positioned at $2,586, $2,540, and $2,499 respectively. These technical indicators demonstrate the strength of the preceding rally before Wednesday’s retracement.
Spot ETF Demand Continues Robust Performance
Ethereum spot ETFs in the United States demonstrated substantial demand heading into the correction. Farside Investors documented $270 million in net capital inflows on September 21 and an additional $162.2 million on September 22, accumulating to a combined $432.2 million across both sessions.
Forthcoming flow data will reveal whether institutional buying persisted as ETH experienced rejection from the $2,800 level.
Cryptocurrency analyst Ted Pillows identified $2,550 as Ethereum’s most significant liquidity concentration, indicating the digital asset might retest that zone before attempting another advance. He additionally highlighted a whale entity acquiring $119.67 million in ETH within a single trading day, characterizing this activity as strategic accumulation.
The $2,550 zone aligns closely with the 4-hour 100-period moving average at $2,540 and a significant retracement threshold at $2,532. These technical levels would become relevant only if ETH breaches the September 23 low of $2,648.
Derivative Positioning and Blockchain Metrics
Open interest across ETH derivative markets has remained relatively stable near 13 million ETH since late August. While ETH’s dollar-denominated price surged 70% from its June bottom, open interest expanded 60% to $34.8 billion — this divergence suggests leveraged market participants have exercised restraint.
On-chain network activity has failed to match price appreciation. Active wallet addresses and transaction volume on the mainnet have remained stagnant or declined throughout the previous three-month period.
Ethereum witnessed approximately $119 million in position liquidations during the past 24-hour period. Long position liquidations constituted $95.8 million of this figure, according to Coinglass tracking data.
Short-term momentum indicators continue displaying positive characteristics. The MACD remained elevated above its signal line at 96.80 versus 83.87, while Aroon Up registered 85.71% compared to Aroon Down at 42.86%.
A liquidation heatmap from CoinGlass reveals concentrated clusters near $2,700 and $2,650 — price zones that may experience additional pressure should selling persist.
For bulls to regain control, ETH must recapture the $2,710 level and subsequently break through $2,789 to resurrect the $2,800 breakout scenario. The most recent session low at $2,648 represents the immediate downside level requiring monitoring.

