



Key Takeaways
- ETH continues to hover around $2,486–$2,500, confined within a narrow corridor for more than three weeks.
- Futures open interest has failed to keep pace with price appreciation, indicating limited conviction among leveraged market participants.
- Tuesday witnessed $24.3 million in net withdrawals from US spot Ethereum ETFs.
- Primary resistance zone lies between $2,525–$2,535; breaking above could propel prices toward $2,550–$2,600.
- Critical downside levels include $2,478, $2,435–$2,445, and the stronger support zone at $2,350–$2,360.
Ethereum continues hovering around the $2,486 level as of September 9, maintaining its position just beneath the psychologically significant $2,500 threshold following an extended period of narrow-range consolidation. Price action has remained trapped between $2,431 and $2,544 without establishing a definitive directional trend.
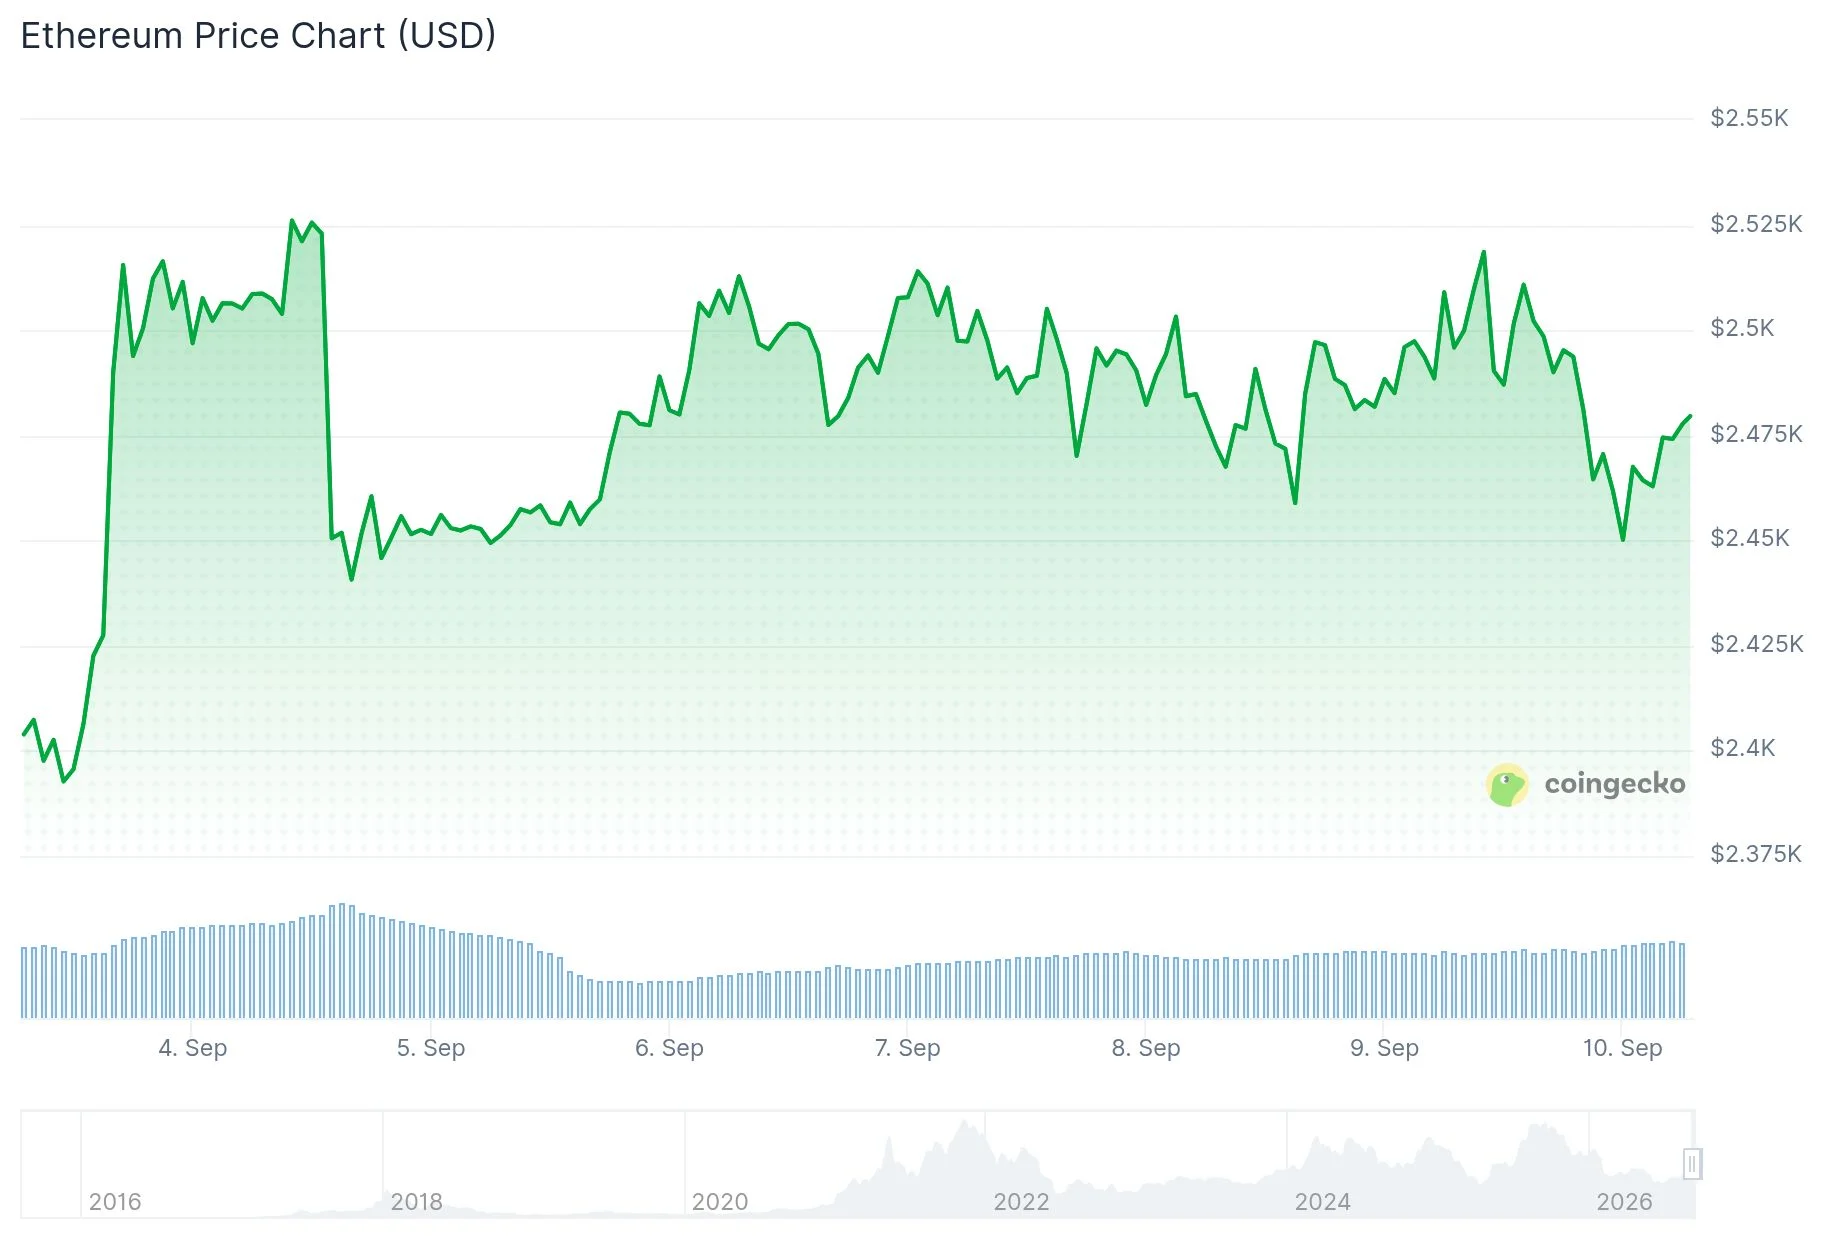
The $2,478–$2,485 region has consistently attracted buying activity, yet each upward push has encountered substantial resistance within the $2,525–$2,535 band. This overhead barrier has repeatedly rejected price advances since Ethereum’s August rally concluded.
Currently, ETH maintains its position above the 20-, 50-, 100-, and 200-day Exponential Moving Averages, suggesting the longer-term technical structure remains favorable for bulls. The 20-day EMA, positioned near $2,403, represents the nearest dynamic support level beneath current trading ranges.
The 14-day Relative Strength Index registers in the lower 60s, while the Stochastic Oscillator hovers around 62. These technical indicators point to the presence of bullish momentum, though insufficient strength to catalyze a decisive breakout attempt.
Futures Market Signals Limited Confidence
Ethereum futures open interest has declined by approximately 1 million ETH since July, despite ETH recording a 58% price gain during the same timeframe. When measured in dollar value, open interest increased 54% to reach $33.7 billion — however, price appreciation exceeding open interest growth indicates leveraged long positions are not accumulating aggressively.
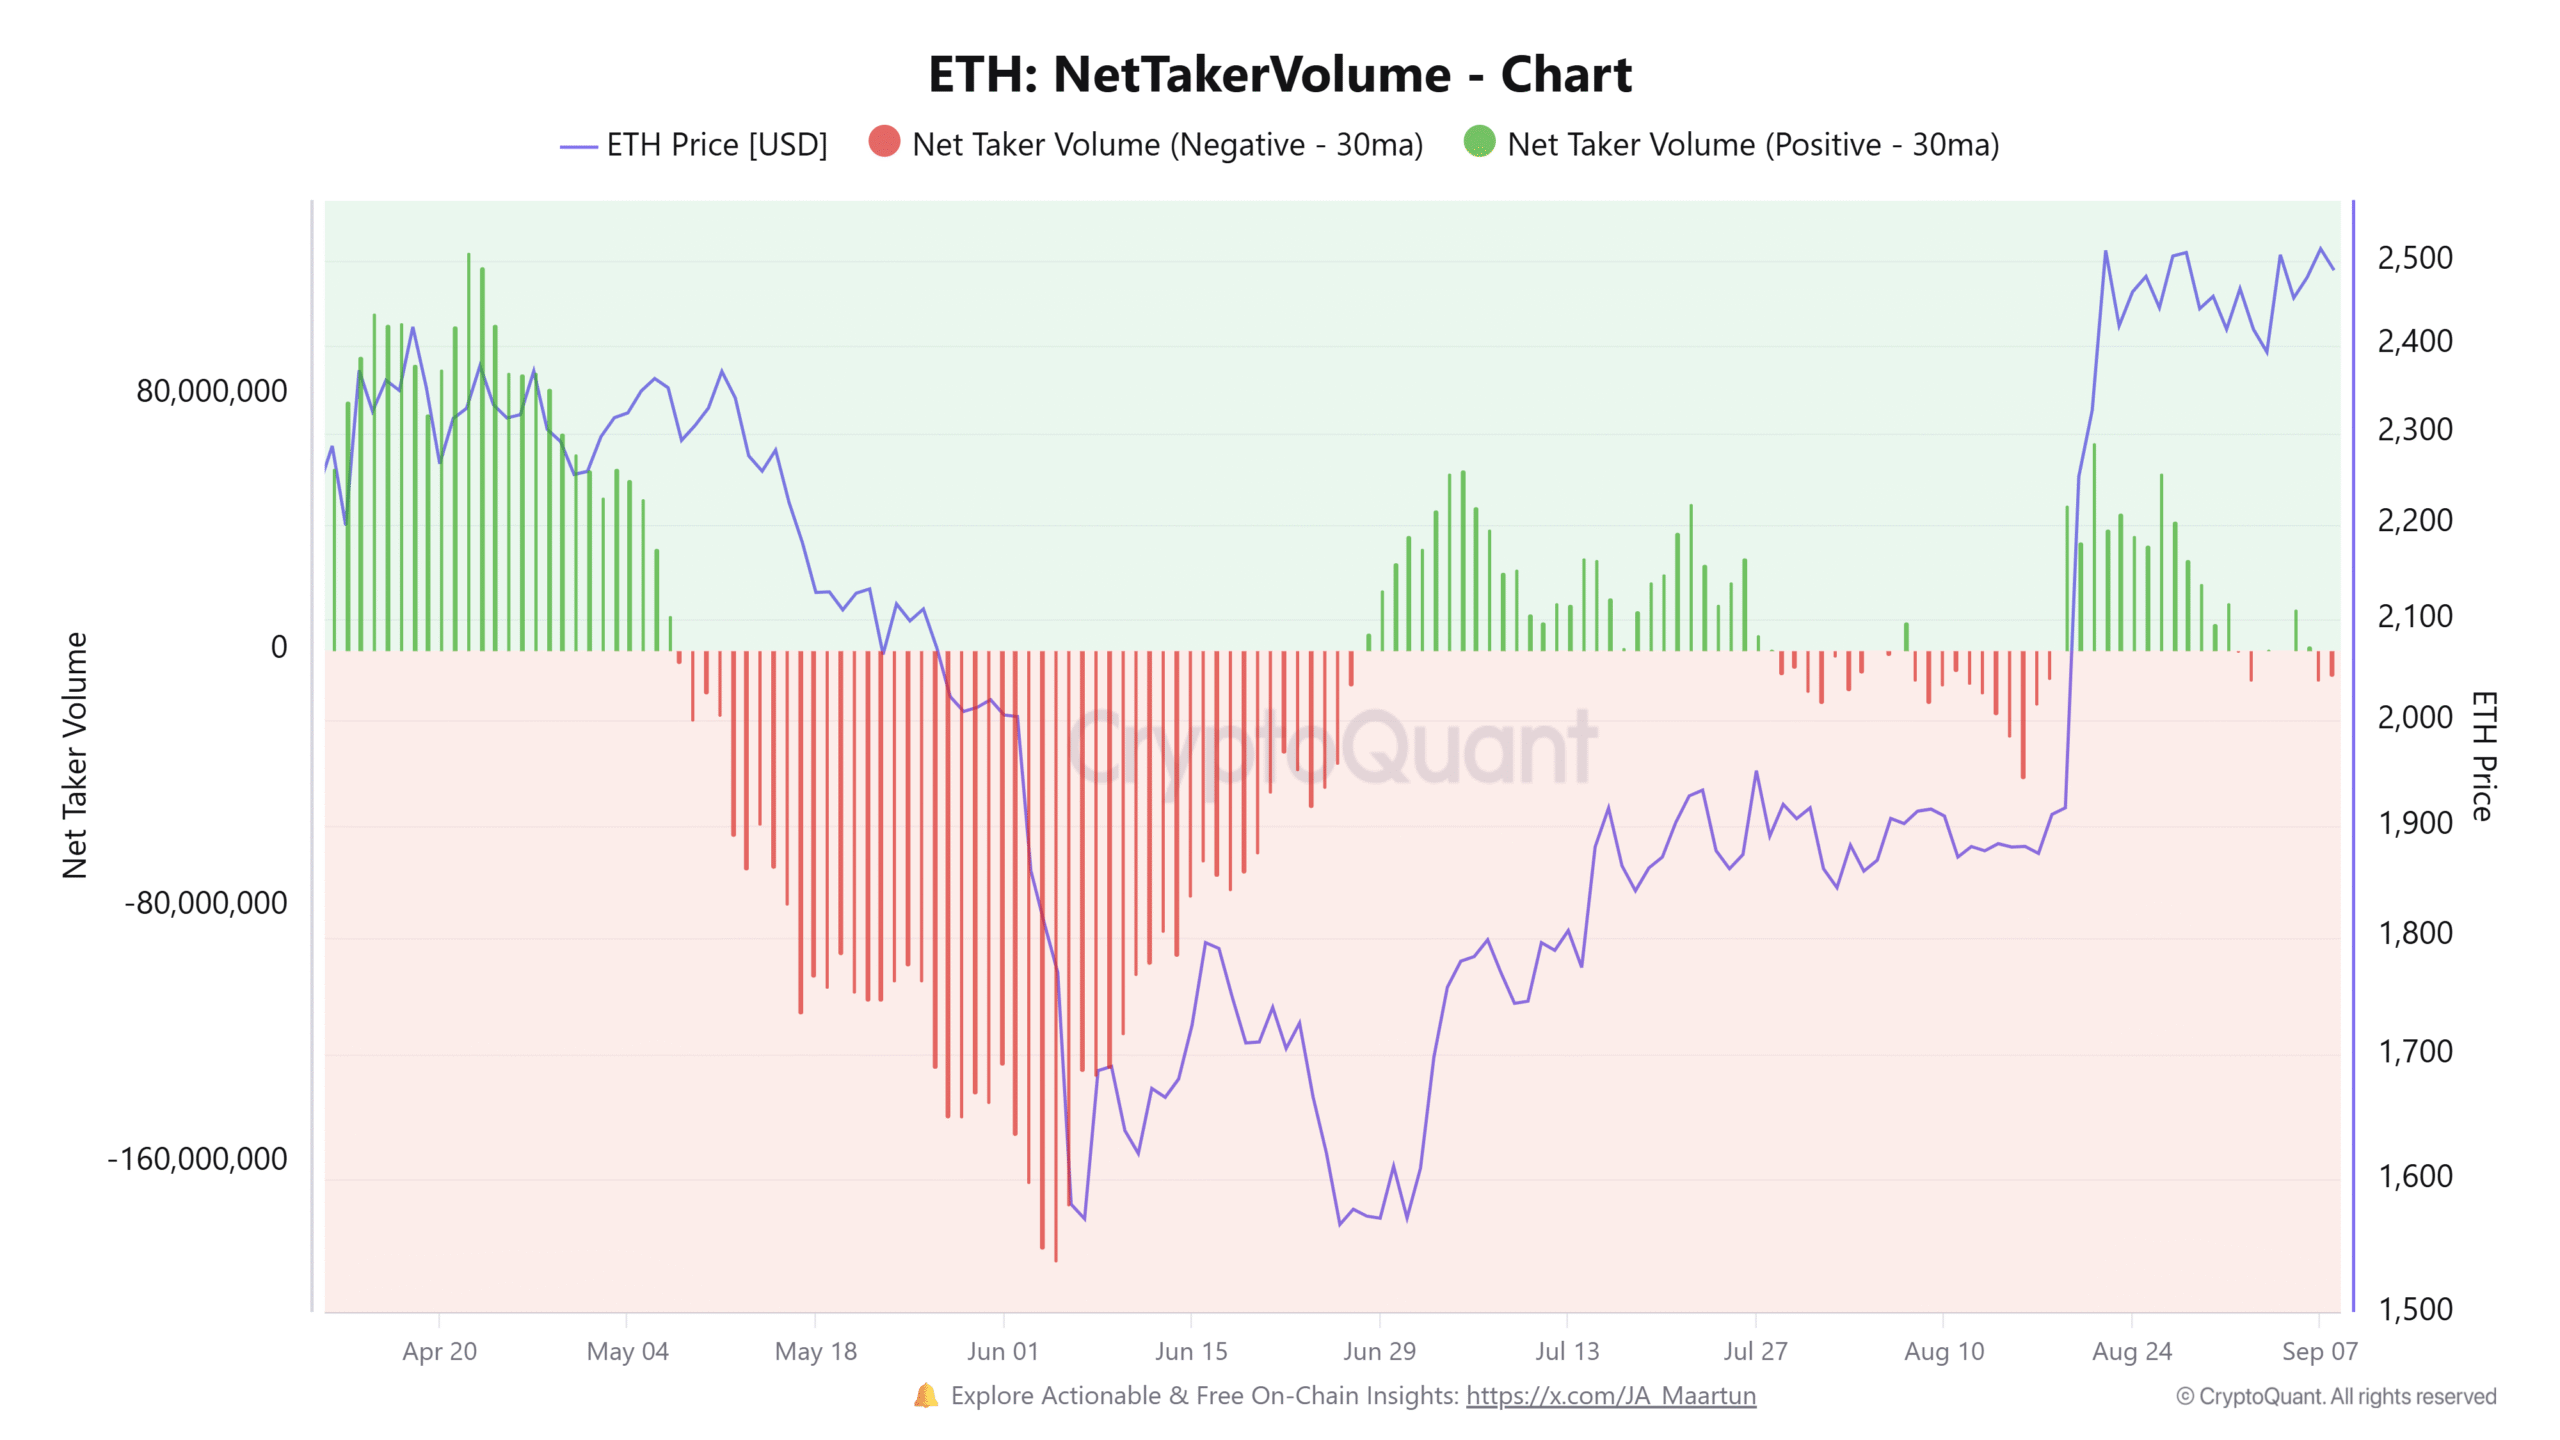
Net Taker Volume across perpetual futures contracts has turned negative in recent sessions, reflecting balanced positioning between bullish and bearish derivatives traders.
Blockchain data reveals ETH withdrawals from centralized exchanges have marginally exceeded deposits throughout the past week. This pattern suggests modest accumulation in spot markets, though the differential remains relatively minor.
US-based spot Ethereum ETFs recorded $24.3 million in net outflows on Tuesday, representing a reduction in institutional buying pressure during this consolidation phase.
Critical Price Zones Under Surveillance
Market analyst Jules highlighted the $2,478–$2,485 range as the crucial near-term pivot point, observing that multiple price bounces from this area demonstrate substantial demand. Jules commented: “Both sides have clean levels. The longer this squeeze lasts, the more the eventual break will matter.” Jules further noted that a decisive close above the $2,525–$2,535 resistance could establish a pathway toward $2,580–$2,600.
Market analyst Ted Pillows pinpointed $2,550 as a significant resistance threshold, suggesting that a robust weekly close above this level could facilitate an advance toward the $3,000 milestone.
Cryptocurrency trader Daan Crypto Trades (@DaanCrypto) shared on X that $ETH has been “chopping around in a tiny range for the past 3 weeks” and that this price compression would ultimately result in a substantial directional move. He emphasized $2,350 as the vital support level bulls must defend and $2,550 as the key resistance barrier requiring a breakout.
The CoinGlass liquidation heatmap reveals concentrated short liquidation clusters between $2,520 and $2,550, with downside liquidity pools centered near $2,430 and a more substantial accumulation zone around $2,355–$2,365.
Ethereum recorded $30.6 million in aggregate liquidations during the past 24 hours, with short positions accounting for $15.6 million of that total.

