



TLDR:
- Ethereum price fell 1.22% to $2,487.51 at 4:40 a.m. ET. A weekly close below $2,550 keeps the $2,400 support level exposed.
- August CPI rose 0.4% monthly, while annual inflation held at 3.4%. CME FedWatch then showed an 87% chance of a September rate hike.
- U.S. spot Ether ETFs drew $216.4 million on September 11. Those ETF inflows reversed the previous day’s $29.9 million net outflow.
- An X commentator calculated a 60.62% Q3 gain through September 13. Repeated rejections still keep the $2,550 weekly level in focus.
The Ethereum price fell to $2,487.51 after a 0.38% seven-day decline. The move pushes the token below $2,500 after repeated tests of nearby resistance. According to Coingecko data, ETH price traded within the $2,400-to-$2,550 range.
Short-term pressure follows stronger U.S. inflation readings, firmer Treasury yields, and reduced weekend liquidity. Yet the wider picture is mixed, as spot Ether funds recorded fresh demand on Friday while Q3 performance stays strong.
Traders now focus on the weekly close near $2,550. That level separates another failed breakout from a possible extension toward $3,000 during September trading.
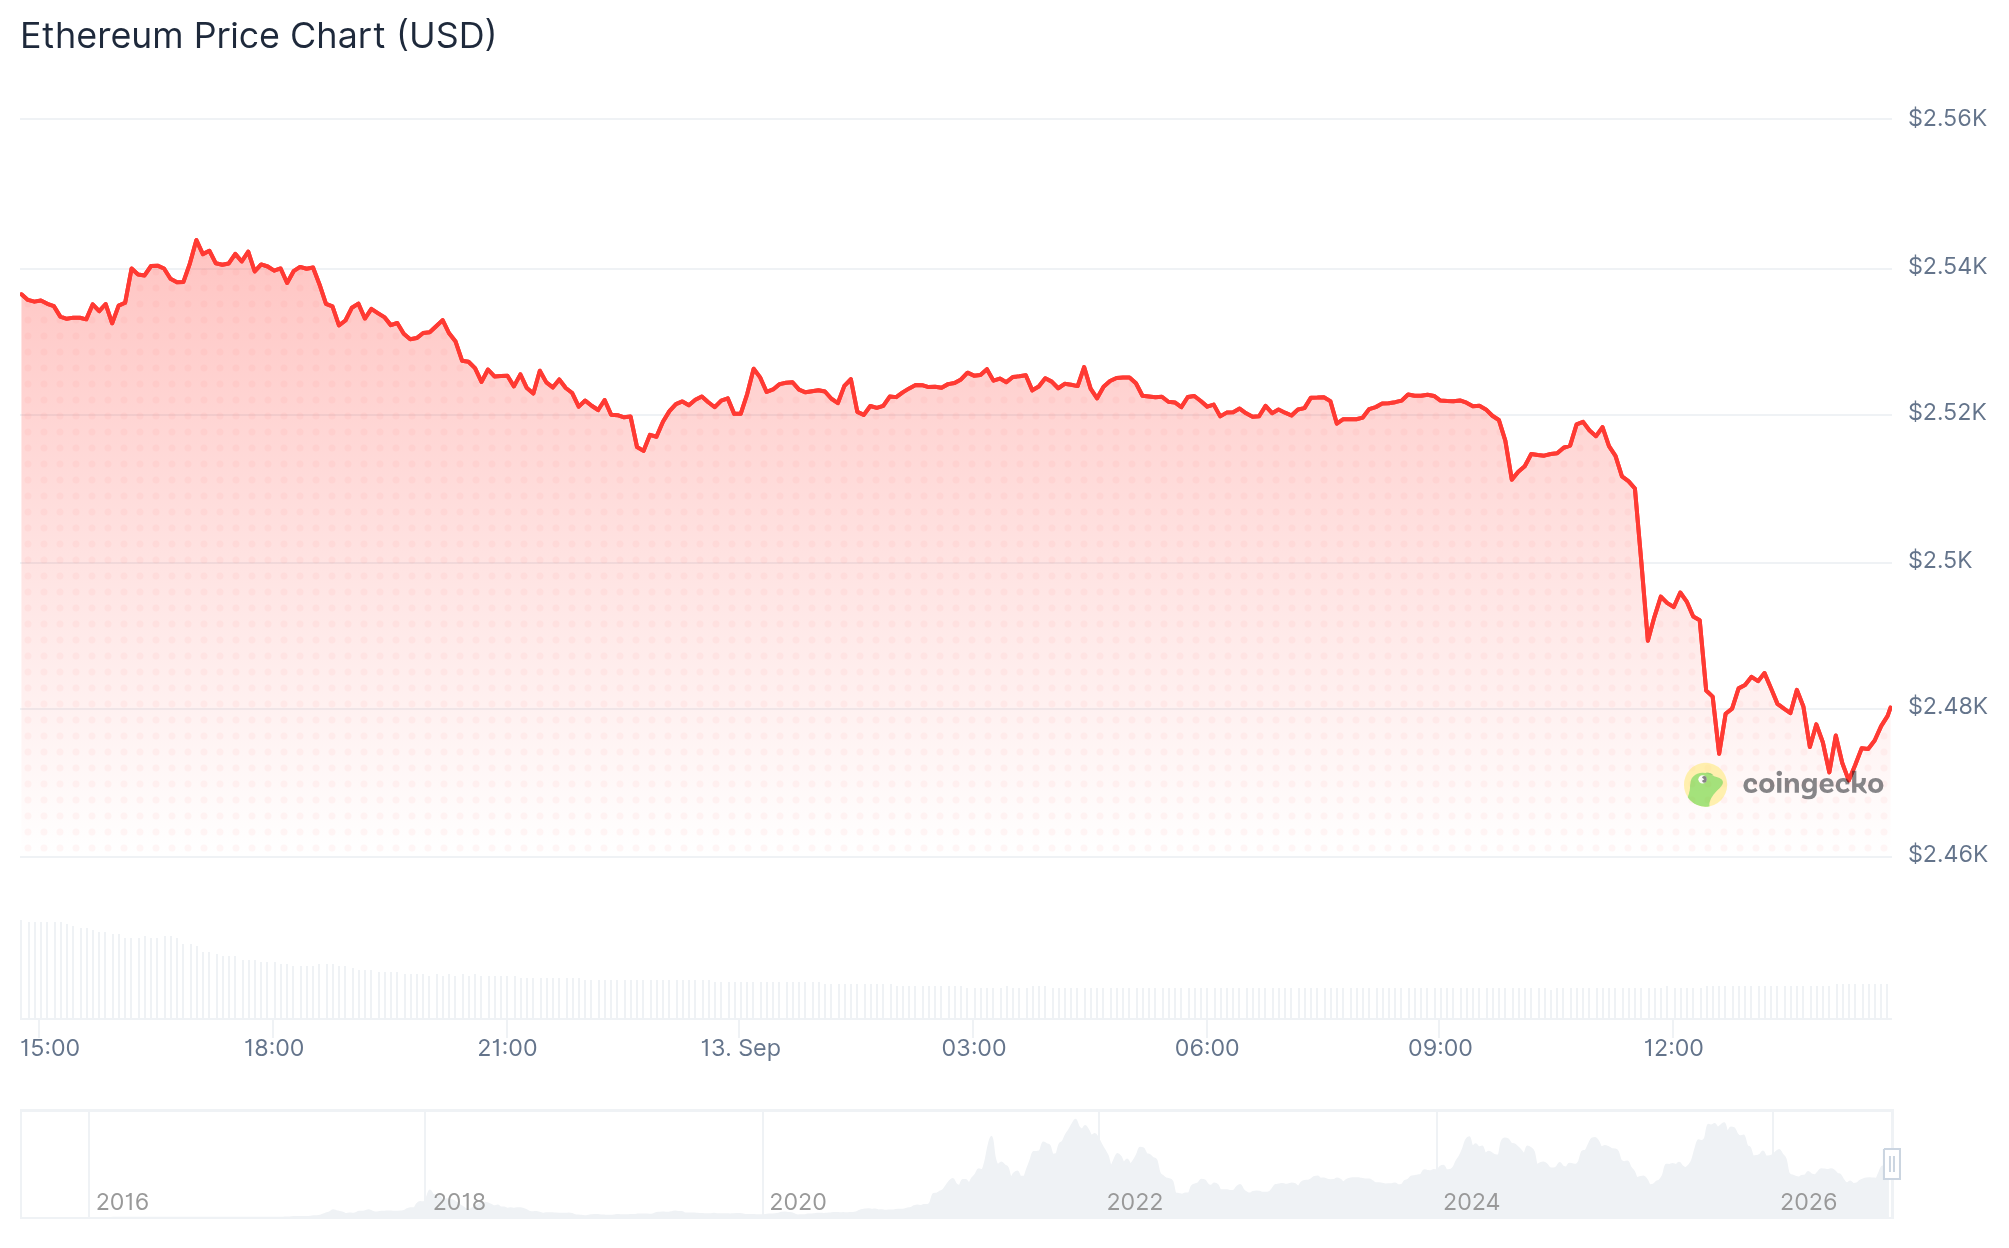
Ethereum Price Weakens as Inflation Raises Rate Bets
Macro data explain part of the short-term weakness. The Bureau of Labor Statistics said August CPI rose 0.4% monthly and 3.4% annually. Core CPI increased 0.3% for the month, but annual core inflation eased to 2.4%. Meanwhile, final-demand producer prices climbed 0.4% monthly and 5.4% yearly.
Interest-rate futures responded quickly. CME FedWatch pricing showed an 87% probability of a quarter-point September increase after the CPI release. That reading rose from 72% one day earlier.
Firmer rate expectations lifted Treasury yields and raised financing costs across risk markets. The Ethereum price then encountered selling near an established technical ceiling.
Weekend conditions added another constraint. Crypto order books often carry less depth outside normal institutional trading hours. Smaller trades can therefore move prices farther and trigger leveraged positions. One derivatives heatmap places more than $1.21 billion in cumulative long exposure below $2,405. It estimates potential liquidations, not completed losses or on-chain transfers.
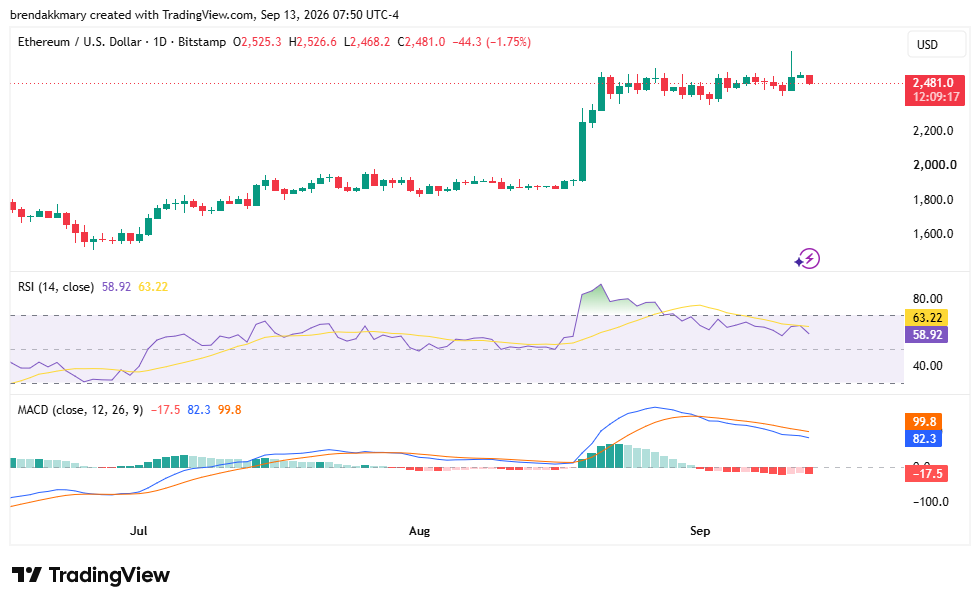
Technical readings do not yet show a decisive trend, as the MACD indicator is residing on the negative sentiment while the RSI is at 58.92. Meanwhile, Williams %R is 54.027.
The platform classifies all three readings as neutral signals overall. However, price location gives the weekly close greater weight.
Analyst Ted Pillows says a close below $2,550 could weaken the ETH outlook during the coming weeks. The threshold overlaps key 50-week moving-average resistance around $2,542–$2,550.
Ethereum price must regain that zone to reduce immediate rejection risk. Failure would keep $2,405 and $2,400 visible as nearby downside levels. A deeper break could accelerate forced selling across heavily leveraged centralized exchange positions.
ETF Inflows and Whale Activity Shape the ETH Outlook
Fund flows offer a counterweight to the pullback. Farside Investors recorded $216.4 million in U.S. spot Ether ETF inflows on September 11. The result reversed a $29.9 million outflow from September 10. It also lifted the September 8-to-11 total to $196.9 million.
Those figures show uneven demand, not a continuous withdrawal. BlackRock’s ETHA led Friday with $148.8 million, followed by Bitwise’s ETHW at $29.1 million. Fidelity’s FETH added $11.4 million, while Grayscale’s ETH fund took in $5.1 million. ETF inflows therefore continued despite the macro repricing.
On-chain activity presents a more divided picture. Lookonchain tracked a whale’s five-day sale of 167,855 ETH worth $408 million. The Ethereum price still held near $2,500 after that distribution, which suggests buyers absorbed a large supply event. Earlier reported withdrawals cut exchange balances by 116,000 ETH during early September.
Market sentiment is mixed, while resistance has limited follow-through. An X commentator calculates ETH’s Q3 gain at 60.62% through September 13. That ranks as its second-best third quarter, behind a 66.55% increase in 2025. Those figures follow declines during both Q1 and Q2.
Even so, historical performance does not confirm an advance. Ethereum price continues moving inside a band, with $2,500 acting as a near-term pivot. A weekly close above $2,550 would improve the ETH outlook and expose $3,000. Continued rejection would keep the market focused on $2,405.
Fund demand stayed positive through the week. It does not remove immediate liquidation risk. At $2,487.51, Ethereum price sits between institutional inflows and an unresolved weekly resistance test.

