


Many people ask the same question about Bitcoin: is it too late to buy? The answer depends on the time frame, the data you use and how much risk you can handle.
This article reviews the numbers from three sources: Nexo, The Motley Fool and CoinLedger. Each source has its own date and its own view. Where the figures differ, we name the source.
Bitcoin prices can swing fast, and past results do not predict future ones. This article is for information only and is not financial advice.
Bitcoin Price Data: One Asset, Several Numbers
The Motley Fool published its article on July 15, 2026. It said Bitcoin traded at about $62,000 as of July 13. That was about 50% below the all-time record set in October 2025.
The same Motley Fool page also showed a live price of $80,740, with a day’s range of $80,444 to $83,005. The Nexo page showed $80,604.81 when it was captured. Those ticker prices are about $18,700 above the July 13 figure.
The 52-week range on the Motley Fool page runs from $57,945.16 to $116,041.09. The high is about twice the low. At $80,740, Bitcoin sits about 30% below that high, based on our calculation.
| Data point | Figure | Source |
|---|---|---|
| Price on July 13, 2026 | About $62,000 | The Motley Fool |
| Live price on page | $80,740 | The Motley Fool |
| Live price on page | $80,604.81 | Nexo |
| Day’s range | $80,444 to $83,005 | The Motley Fool |
| 52-week range | $57,945.16 to $116,041.09 | The Motley Fool |
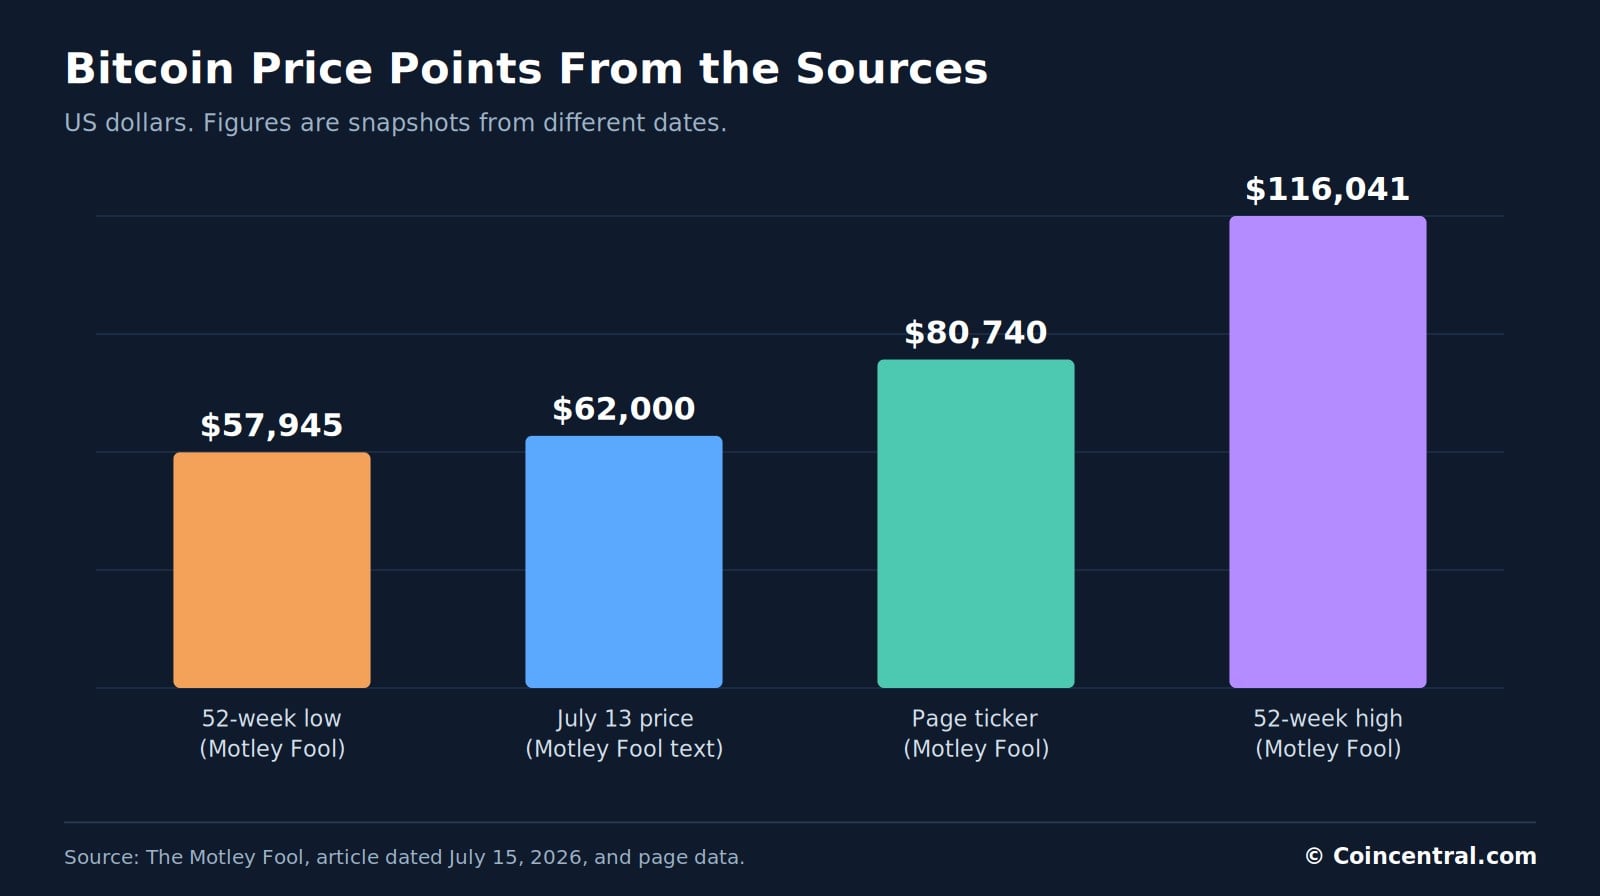
These numbers show why a single price can mislead. A reader who sees $62,000 in July and $80,740 on a ticker will draw different conclusions. Dates matter when you read any Bitcoin statistic.
Price alone does not answer the question of timing. It only shows where Bitcoin trades compared with its recent past. The sections below add context from cycles, supply, market size and returns.
The Nexo page also listed other assets. Ethereum was $2,349.39, Solana was $101.66 and XRP was $1.2993. Nexo showed the overall market down 2.85% over 24 hours, with Bitcoin down 2.66% and Ethereum down 5.26%.
Boom-and-Bust Cycles and Drawdown Statistics
The Motley Fool says Bitcoin has gone through boom-and-bust cycles many times. No two cycles are the same, but past large drawdowns have been followed by strong bull markets. The author says it is only a matter of time before the price trends higher, which is an opinion and not a fact.
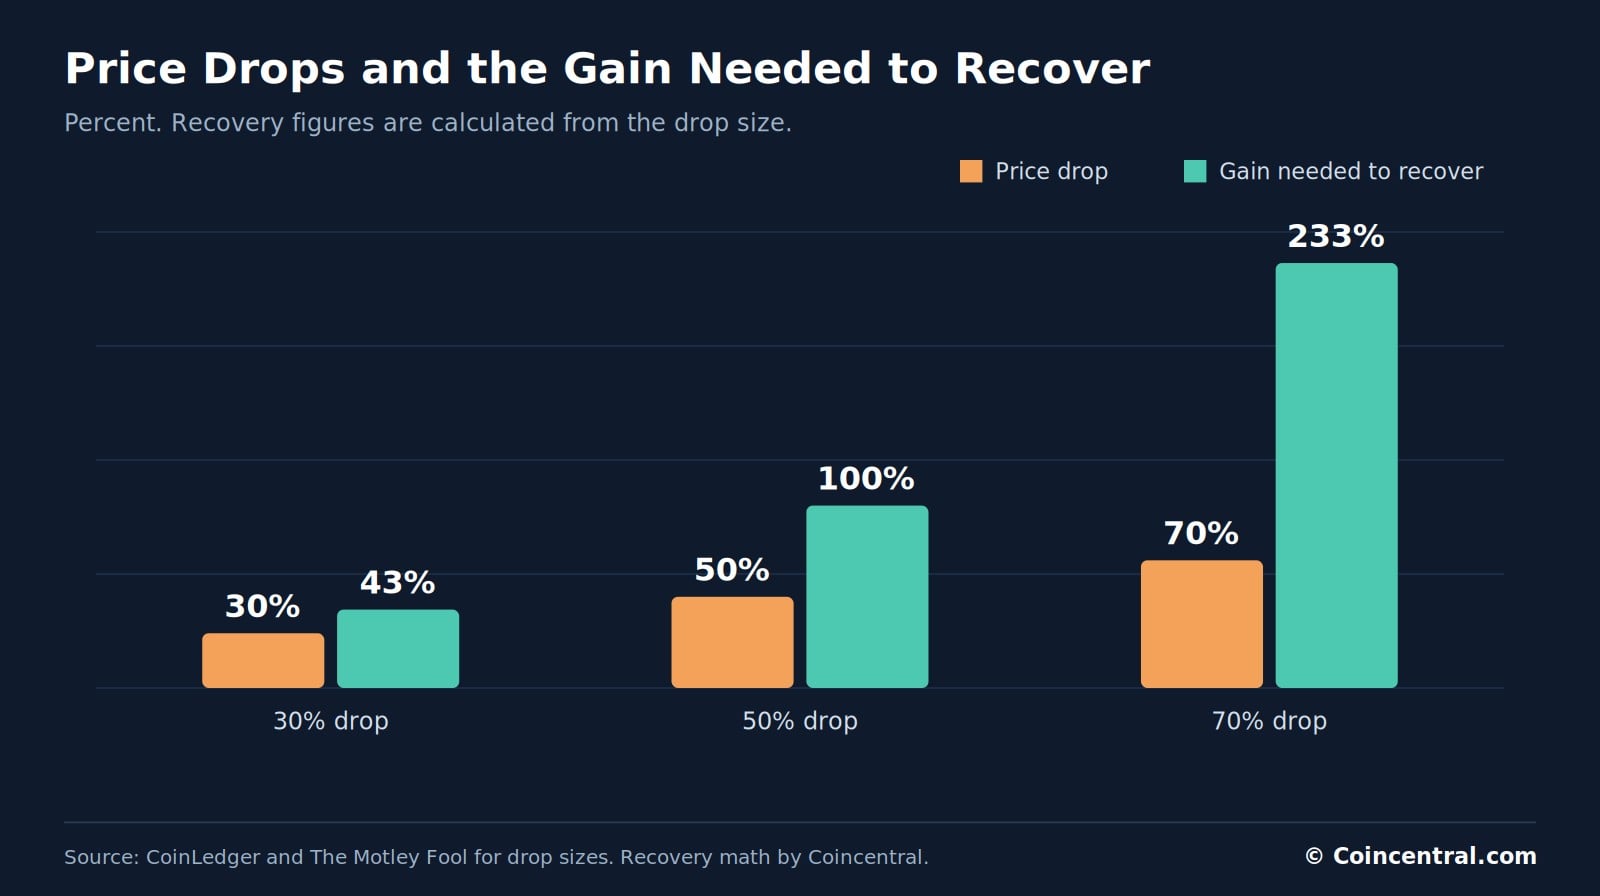
CoinLedger gives a firmer number. It says Bitcoin has had multiple crashes of 70% or more, followed by recoveries to new all-time highs. It also says another crash is very likely.
Drawdowns are hard to recover from because of simple math. A 50% loss needs a 100% gain to break even. A 70% loss needs a gain of about 233%.
| Price drop | Value of $10,000 after the drop | Gain needed to recover |
|---|---|---|
| 30% | $7,000 | About 43% |
| 50% | $5,000 | 100% |
| 70% | $3,000 | About 233% |
The recovery figures in the table are our calculations. They are not taken from the sources.
CoinLedger also looks back to 2011. Back then, Bitcoin was hard to buy, few exchanges existed and public trust was low. Mainstream outlets often predicted its collapse.
Since then the price has grown from under $1 to more than $120,000, according to CoinLedger. Nexo makes a similar point. It says the “too late” call has been made at every major price level and has been wrong over multi-year periods.
That record does not guarantee a repeat. Nexo itself says no one can promise the price will rise. It only argues that waiting for a perfect entry has often cost more than an imperfect one.
Prices move in cycles, and Nexo says there will always be drawdowns. It adds that people who wait for absolute certainty often end up with neither the dip they wanted nor the gains they missed.
Network Activity, Security and the Supply Cap
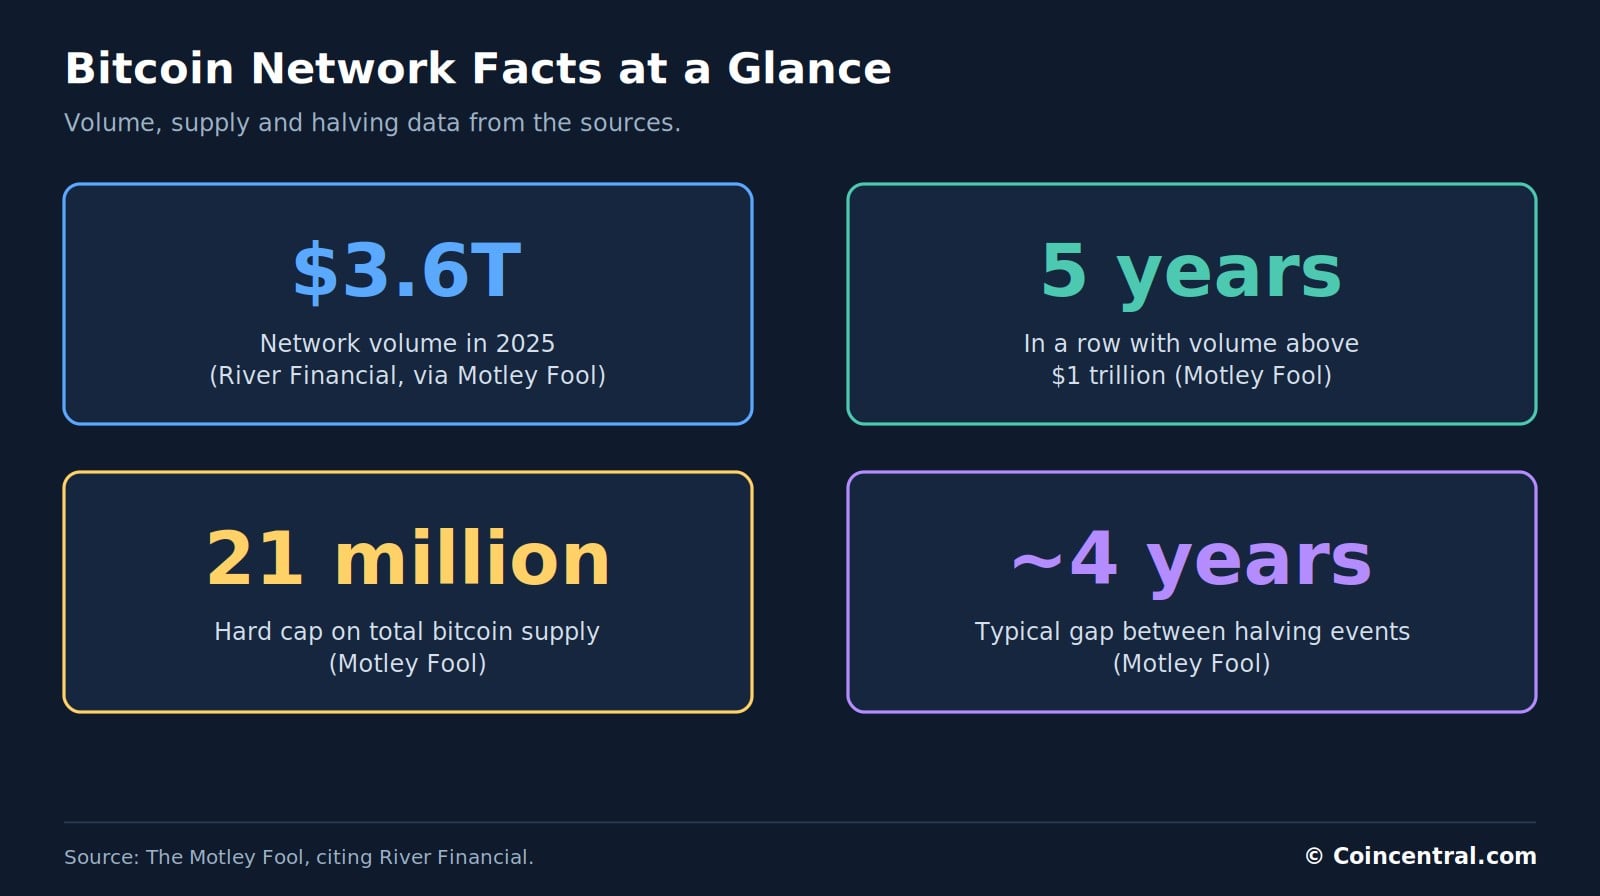
The Motley Fool points to network activity as proof that Bitcoin still works. Citing River Financial, it says Bitcoin processed $3.6 trillion in volume in 2025. That was the fifth straight year with volume above $1 trillion.
The Motley Fool also says the Bitcoin blockchain has never been hacked in its nearly two-decade life. CoinLedger agrees that the protocol has run since 2009 without security issues. It adds that scams have hit exchanges and unrelated crypto projects, but not the Bitcoin protocol itself.
Supply is fixed. Only 21 million bitcoins can ever exist. The Motley Fool calls this cap possibly the network’s most valuable feature, and it notes that halving events have happened about every four years.
The Motley Fool also recalls where Bitcoin began. Its white paper came out in 2008 and let two parties send value to each other without a central party. The page lists trading volume of $39.3 billion for the day.
| Feature | Fact reported | Source |
|---|---|---|
| 2025 network volume | $3.6 trillion | The Motley Fool (River Financial) |
| Years above $1 trillion | Five in a row | The Motley Fool |
| Supply cap | 21 million bitcoins | The Motley Fool |
| Halving events | About every four years | The Motley Fool |
| Network operators | Thousands of independent nodes | CoinLedger |
CoinLedger says the network is kept running by thousands of independent nodes. Every transaction is recorded on a public ledger called the blockchain. No government or central authority controls it.
New products continue to appear. The Motley Fool names the Morgan Stanley Bitcoin Trust as one example. CoinLedger notes that BlackRock and other asset managers have launched Bitcoin ETFs.
Nexo says the approval of spot ETFs permanently sped up institutional adoption. It also says sovereign wealth funds and corporate treasuries have begun to allocate capital to Bitcoin. These are claims from a company that sells crypto services, so readers may want to check them.
Market Size: Bitcoin Compared With Gold and Other Assets
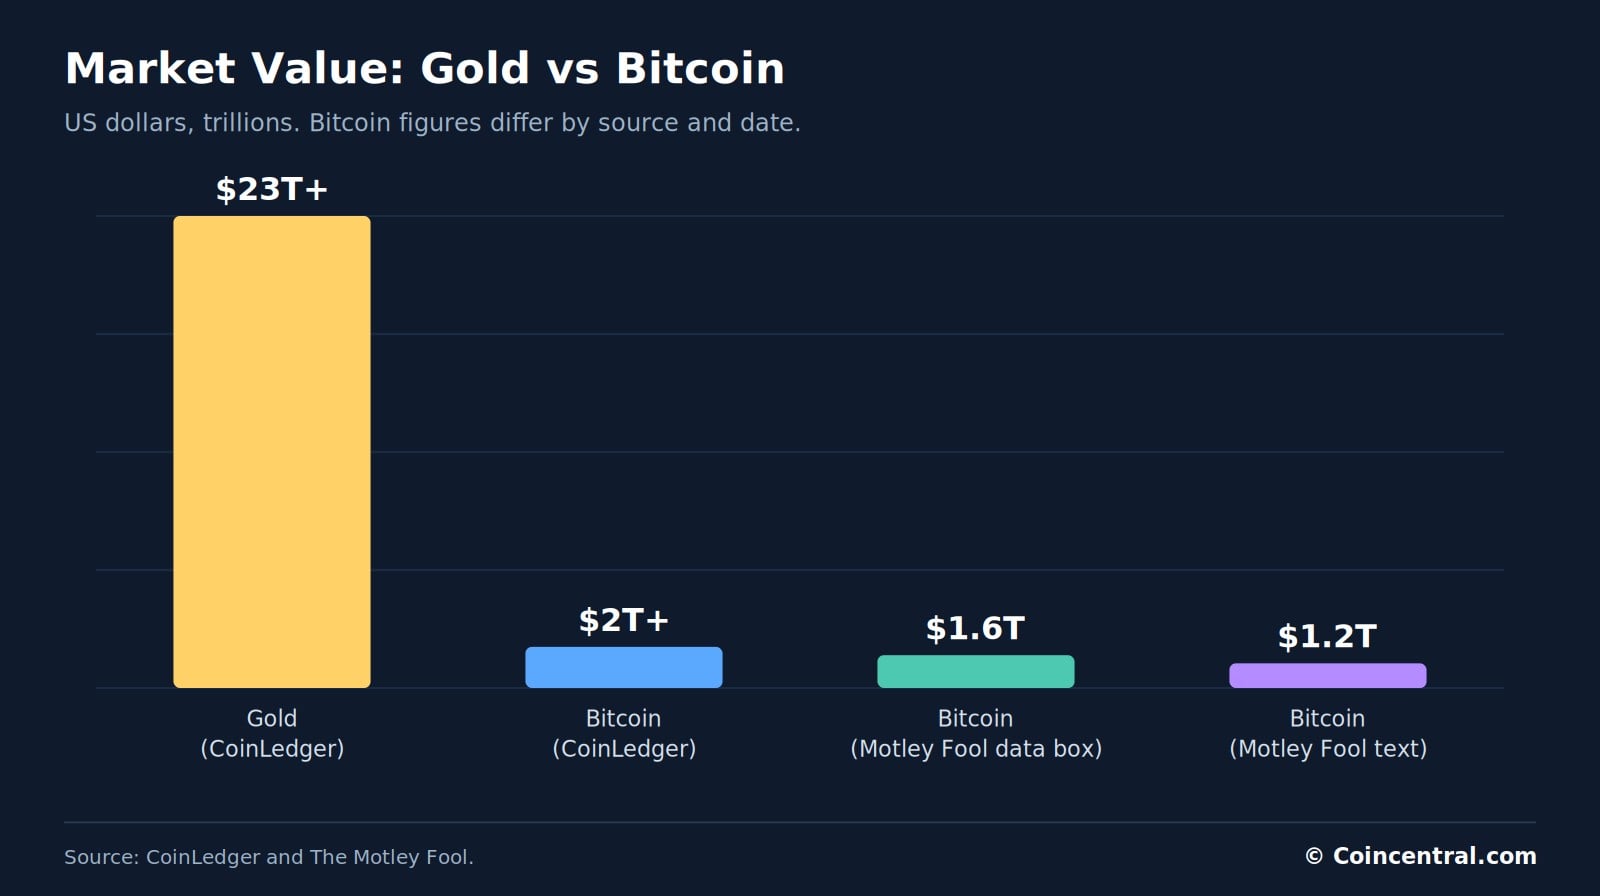
CoinLedger compares Bitcoin with gold. It says gold’s market value is more than $23 trillion, while Bitcoin’s is just over $2 trillion. On those numbers, Bitcoin is worth less than one tenth of gold.
The Motley Fool uses different Bitcoin figures. Its article text gives a market cap of $1.2 trillion. Its data box on the same page shows $1.6 trillion.
The sources do not match because they were written or captured on different dates. Prices moved during that time. Readers should treat each figure as a snapshot.
| Source | Bitcoin market cap | Compared with gold ($23T) |
|---|---|---|
| CoinLedger | Just over $2 trillion | About 9% |
| The Motley Fool (data box) | $1.6 trillion | About 7% |
| The Motley Fool (text) | $1.2 trillion | About 5% |
The percentages in the last column are our calculations.
The Motley Fool also describes a much bigger pool of money. It says the market for a new form of money includes currencies, stocks, bonds, real estate and commodities. It puts that total in the hundreds of trillions of dollars.
The article says that if Bitcoin captured 5% of this in the next 25 years, the upside would be large. Using $200 trillion as a low estimate for “hundreds of trillions,” 5% would be $10 trillion. That is our math, not the source’s.
CoinLedger adds that if Bitcoin one day passes gold in value, buying now could make sense. This is a long-term argument. It depends on events that have not happened.
The Motley Fool says Bitcoin is now a small slice of that total. It describes the network as a monetary system that runs on math and software instead of a central bank. Whether it grows into a larger share is an open question.
Bitcoin vs the S&P 500: Returns and Risk
CoinLedger compares ten-year results. It puts Bitcoin’s gain at more than 10,000% and the S&P 500’s at about 200%. Bitcoin has outperformed the index over that period.
The same source says Bitcoin is riskier. The S&P 500 is a broad index of large U.S. companies and has been one of the more stable long-term investments. Bitcoin is newer and far more volatile.
One day of market data from the Motley Fool page shows the gap. The S&P 500 was down 1.1%, the Nasdaq was down 1.9% and the Dow was down 0.1%. Bitcoin was down 2.6%.
| Asset | 10-year performance | Move on the Motley Fool page |
|---|---|---|
| Bitcoin | More than 10,000% | Down 2.6% |
| S&P 500 | About 200% | Down 1.1% |
| Nasdaq | Not reported | Down 1.9% |
| Dow Jones | Not reported | Down 0.1% |
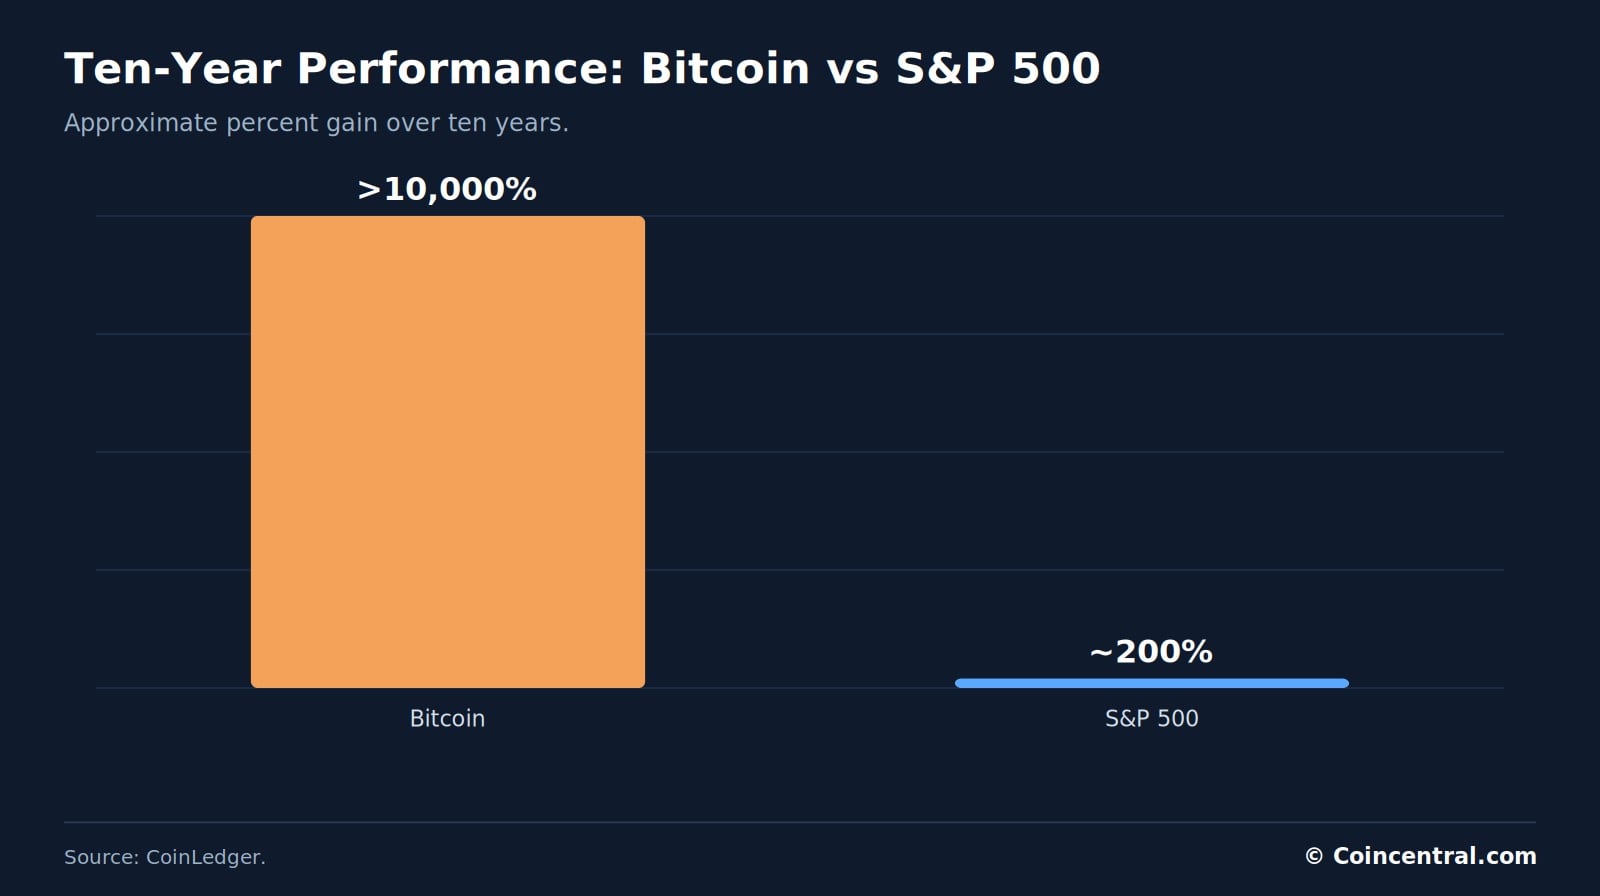
If both figures are total gains, a $1,000 stake would have grown to about $3,000 in the S&P 500. In Bitcoin it would have grown to more than $101,000. This is our math, and it assumes the figures are total gains.
CoinLedger says many investors hold both. They keep a smaller share in Bitcoin for growth and keep broad exposure to stocks. The source also says higher risk tends to go with higher returns, though returns are never guaranteed.
CoinLedger also compares Bitcoin with the dollar. It says the dollar supply has grown sharply since the COVID-19 pandemic, which has raised worries about debasement. Bitcoin’s supply is fixed, but it is far more volatile than the dollar, so it may be riskier if you need cash soon.
Analyst Price Forecasts and Institutional Interest
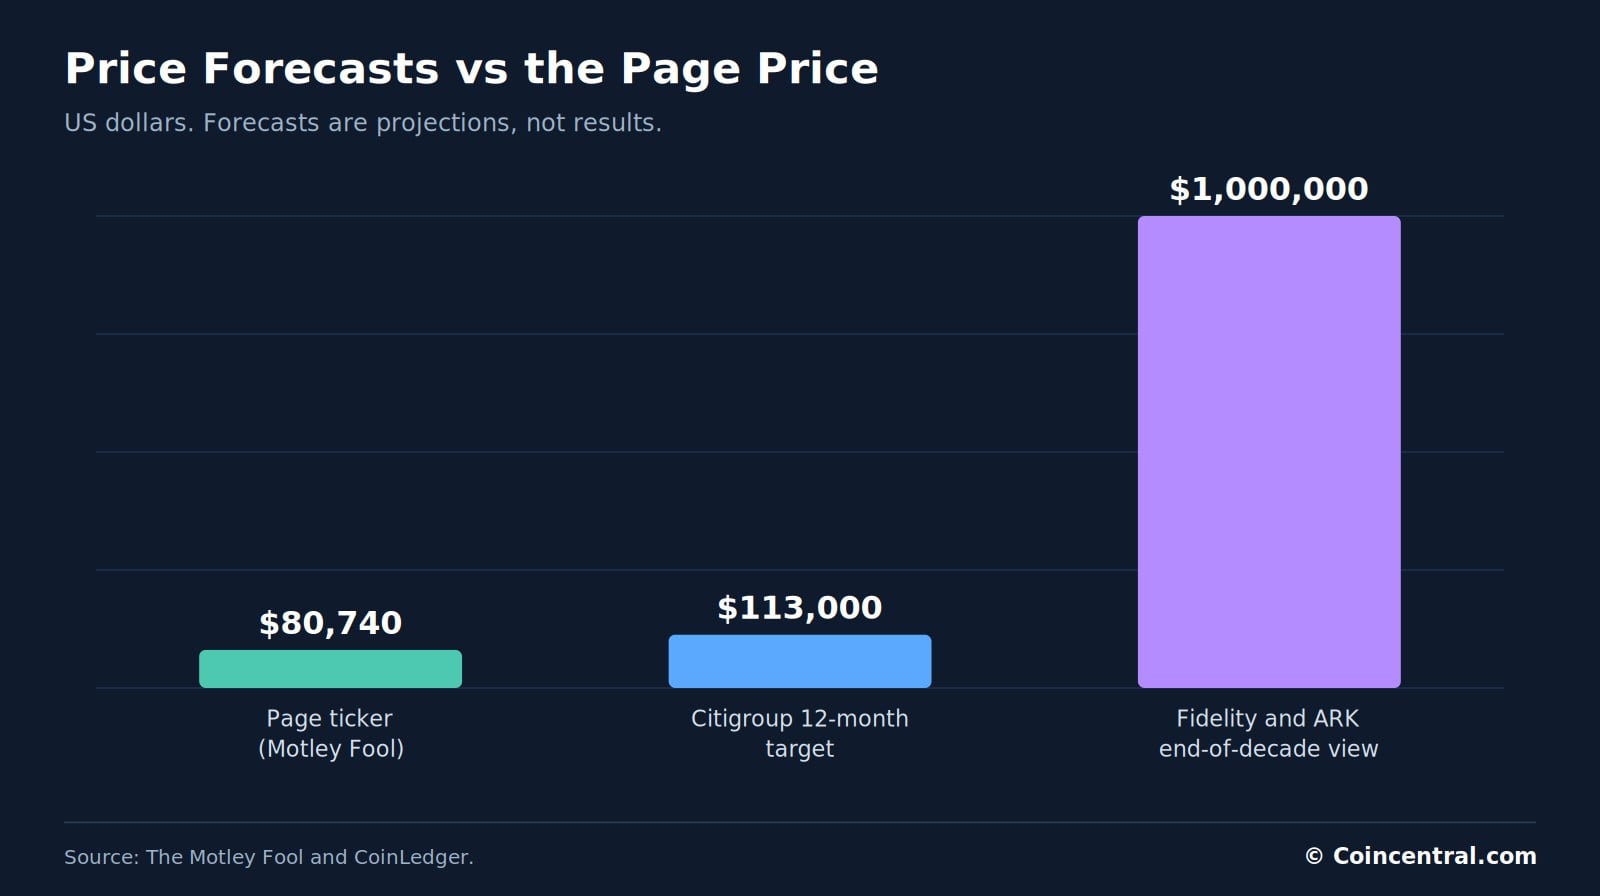
CoinLedger says analysts at Fidelity and ARK Invest have projected that Bitcoin could pass $1 million per coin by the end of the decade. It stresses that these are best-case estimates. They assume ongoing institutional adoption, nations buying Bitcoin for reserves and falling trust in fiat currencies.
A headline on the Motley Fool page, dated October 15, 2026, says Citigroup raised its 12-month Bitcoin price target to $113,000. Compared with the $80,740 price on that page, the target is about 40% higher. A $1 million price would be about 12 times higher.
Forecasts often miss. CoinLedger says even expert predictions are often inaccurate. They show what some analysts believe, not what will happen.
The Motley Fool adds that a bear market has fed the critics who call Bitcoin a failure. The author argues that past cycles point the other way. Both views rest on judgment, since no one can time the market.
| Forecast | Price | Compared with $80,740 |
|---|---|---|
| Citigroup 12-month target | $113,000 | About 40% higher |
| Fidelity and ARK Invest view | $1,000,000 | About 12 times higher |
Institutional steps are easier to count than prices. CoinLedger notes that BlackRock has launched a Bitcoin ETF and that President Trump has announced the U.S. would hold Bitcoin in a strategic reserve. The Motley Fool names the Morgan Stanley Bitcoin Trust.
CoinLedger says Bitcoin is held by some of the world’s biggest financial institutions and soon will be held by the U.S. government. That wording is the source’s. Readers may want to check the latest status of any reserve plan.
Nexo says the global user base keeps growing year after year. It gives no user count, so the claim cannot be checked from the page. Adoption numbers from a neutral source would help here.
Earning Interest on Crypto: Rates and Compounding
Nexo argues that what you do after buying matters as much as the entry price. It says most holders keep their assets idle in a wallet or on an exchange. Its answer is to earn interest on holdings. Nexo sells these services, so the figures below are company claims.
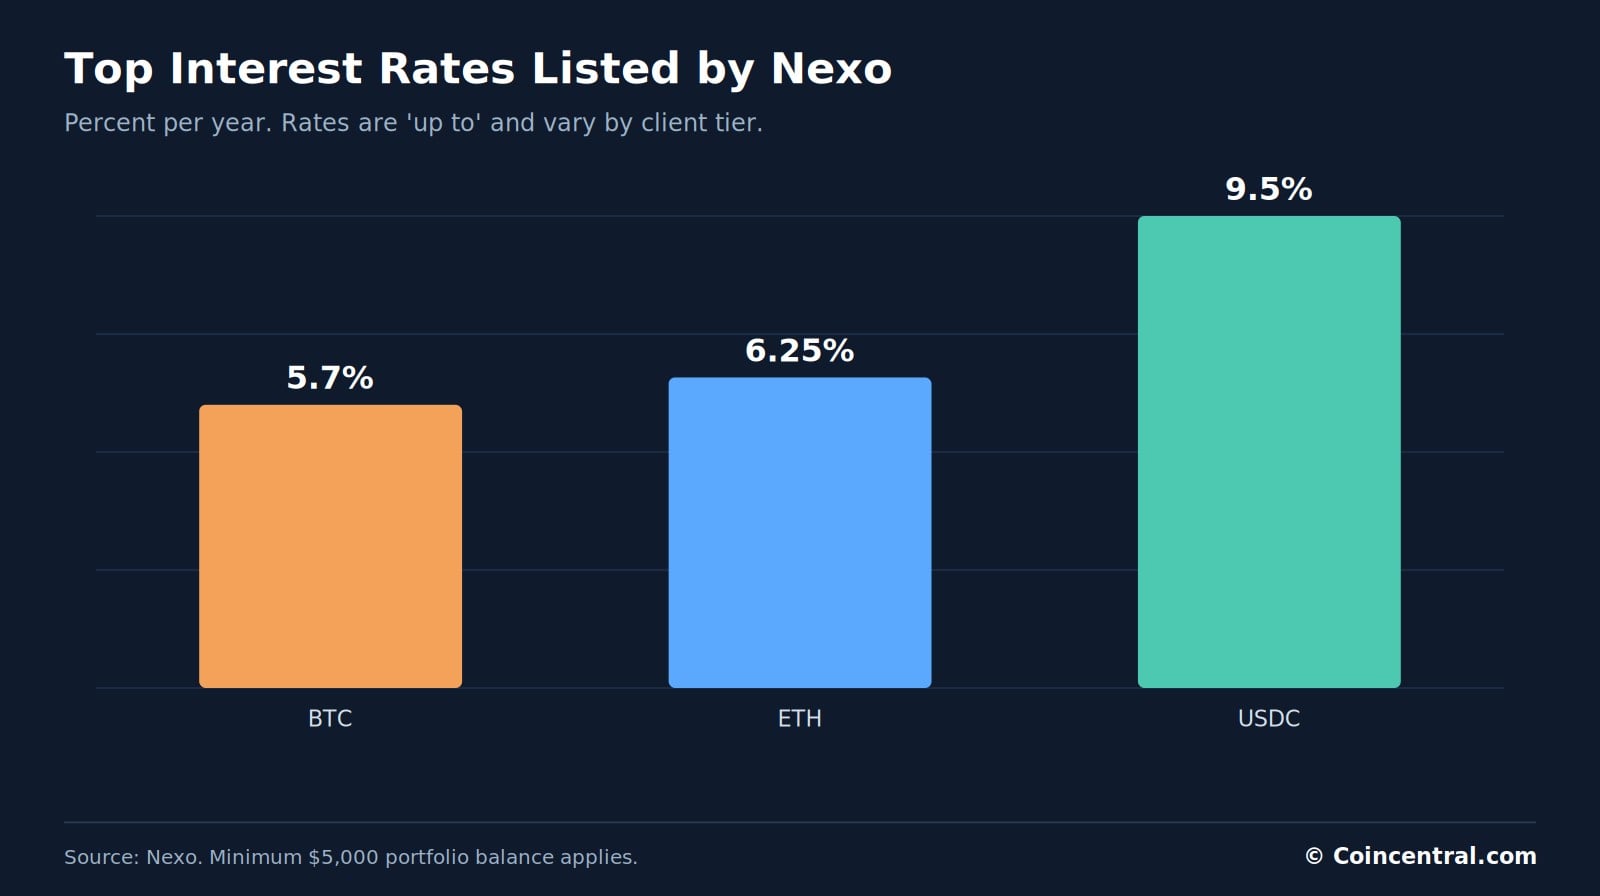
Nexo lists these top rates per year: up to 5.7% on BTC, up to 6.25% on ETH and up to 9.5% on USDC. The rates apply to eligible clients with a minimum portfolio balance of $5,000. They vary by asset and loyalty tier, and they can change.
Nexo says $10,000 earning 5.7% a year grows to about $13,190 over five years, before any change in Bitcoin’s price. Our check shows that figure matches yearly compounding. Daily compounding at the same rate would give about $13,300.
| Asset | Top rate (Nexo) | $10,000 after five years (yearly compounding) |
|---|---|---|
| BTC | 5.7% | $13,194 |
| ETH | 6.25% | $13,541 |
| USDC | 9.5% | $15,742 |
The five-year values in the table are our calculations using the listed top rates. Real results depend on each client’s tier and on rate changes.
Nexo says a USDC position is not subject to crypto volatility. A stablecoin is meant to stay near one dollar. The 9.5% rate is still an “up to” figure and can change.
Interest is not free of risk. Nexo’s own notice says digital assets carry a high degree of risk, are not backed by a government or central bank, and have past results that do not predict the future. Rates marked “up to” may not be available to every client.
Nexo also says earning adds to holding rather than replacing it. If prices rise, a holder gains from both price and a larger balance. If prices move sideways, the balance still grows.
Nexo offers two types of savings. Flexible Savings has no lock-up periods. Fixed-term Savings asks clients to commit funds for a set time, with terms of up to 12 months listed on the Nexo menu, in return for higher yields.
Buying Basics, Risk and the Bottom Line
CoinLedger outlines four steps for new buyers. Use a reputable platform such as Coinbase or Kraken. Move holdings to a cold wallet such as Ledger, which stores private keys offline. Consider dollar-cost averaging, and track your tax duties.
CoinLedger also lists the main reasons people buy Bitcoin. They are scarcity, no central control, global transfers in minutes, wider adoption and diversification. It says Bitcoin often moves independently from stocks.
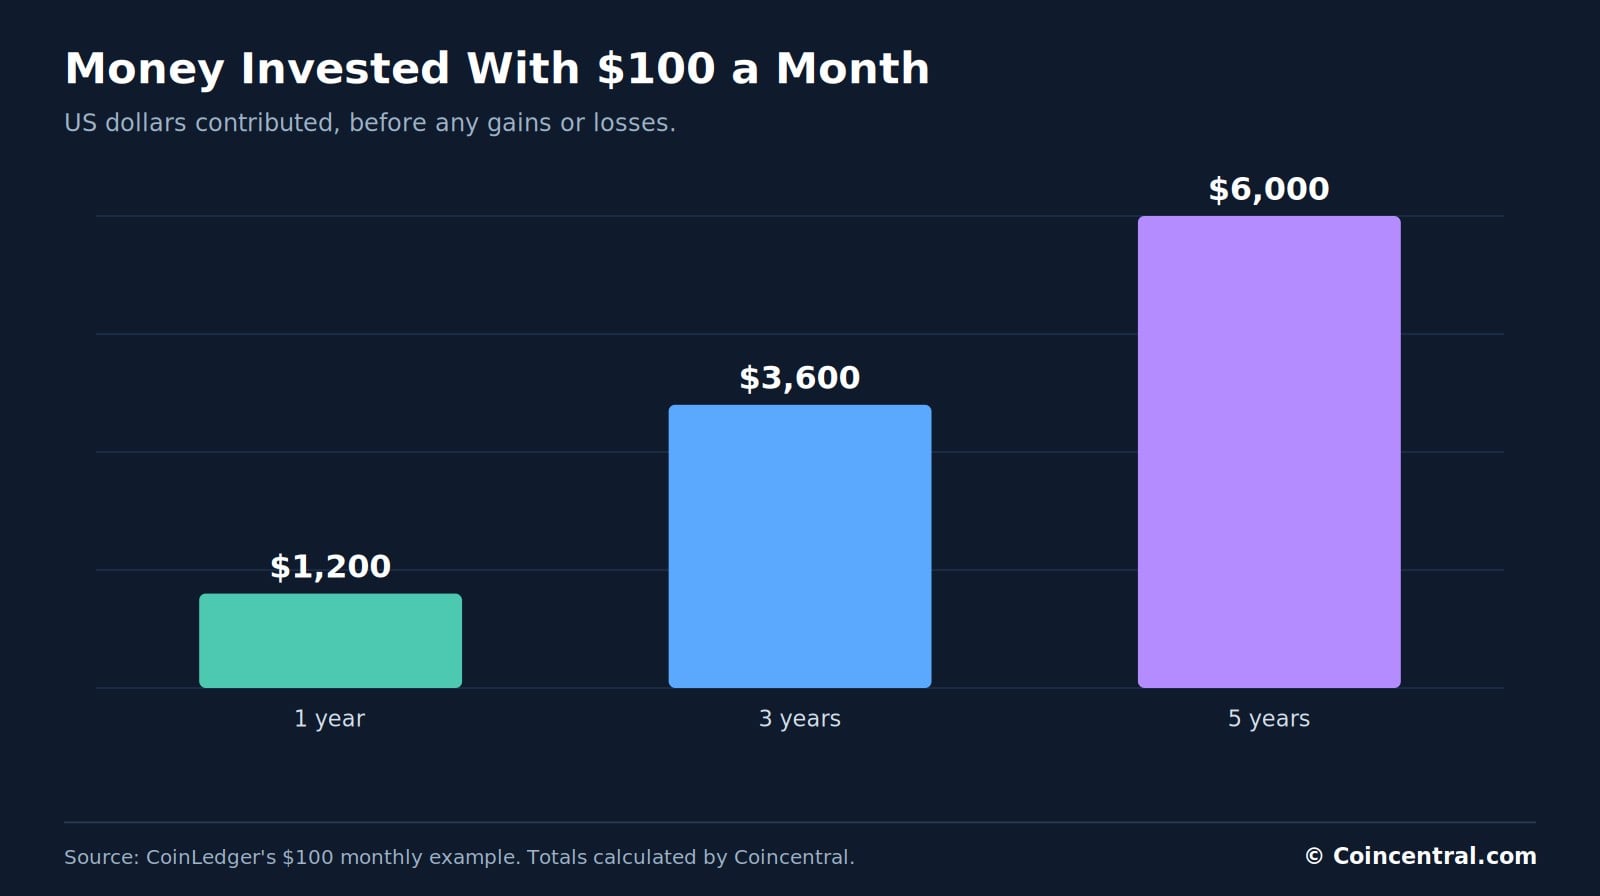
Dollar-cost averaging means buying a fixed amount on a set schedule. CoinLedger gives $100 a month as an example. That adds up to $1,200 in a year and $6,000 in five years, before any gains or losses.
The method removes the need to pick the perfect day. It does not remove risk. If the price keeps falling after you buy, the value of your holdings still falls.
All three sources warn about risk. CoinLedger says never invest more than you can afford to lose. It also says Bitcoin is very likely to crash again, and it urges buyers to avoid panic selling.
Readers should also weigh each source’s interests. The Motley Fool says it has positions in and recommends Bitcoin. Nexo sells crypto savings products, and CoinLedger sells crypto tax software.
So, is it too late? Nexo says probably not, but argues that timing is the wrong question. The Motley Fool says history and fundamentals point to better days. CoinLedger says it is not too late, though returns may not match those of 2011.
| Statistic | Figure | Source |
|---|---|---|
| 52-week price range | $57,945.16 to $116,041.09 | The Motley Fool |
| Past crashes | Multiple drops of 70% or more | CoinLedger |
| 2025 network volume | $3.6 trillion | The Motley Fool |
| Supply cap | 21 million bitcoins | The Motley Fool |
| 10-year gain | More than 10,000% | CoinLedger |
| Analyst view for end of decade | $1 million per coin | CoinLedger |
| Top BTC interest rate | Up to 5.7% a year | Nexo |
The statistics show a volatile asset with a fixed supply, a long record of deep drops and recoveries, and a growing set of institutional products. They do not show where the price goes next. Your time frame and risk tolerance matter more than any single number.

