

TLDR:
- The LTH-SOPR to STH-SOPR ratio has dropped sharply, showing long-term holders are no longer booking large profits.
- Bitcoin’s Supply in Profit has fallen to 47%, matching levels historically seen at the floor of past bear markets.
- Bitcoin is approaching the 200-week moving average and Realized Price, two key support zones from prior cycles.
- Capital rotation toward AI stocks and tech IPOs is driving Bitcoin’s demand shortage, not a structural failure.
Is the market structure starting to change for Bitcoin? That question is gaining traction among analysts and long-term investors.
Bitcoin has slid toward the $60,000 range despite ETF approvals, growing corporate adoption, and clearer regulatory frameworks.
Three on-chain indicators are now offering a data-driven answer to that question — and what they show points toward a bottoming phase rather than a structural breakdown.
What the Data Says About Bitcoin’s Current Market Position
The first indicator drawing attention is the LTH-SOPR to STH-SOPR ratio. This metric compares how long-term holders and short-term holders are realizing gains or losses.
The ratio has fallen sharply in recent weeks. Long-term holders are no longer booking the large profits seen during the previous bull run.
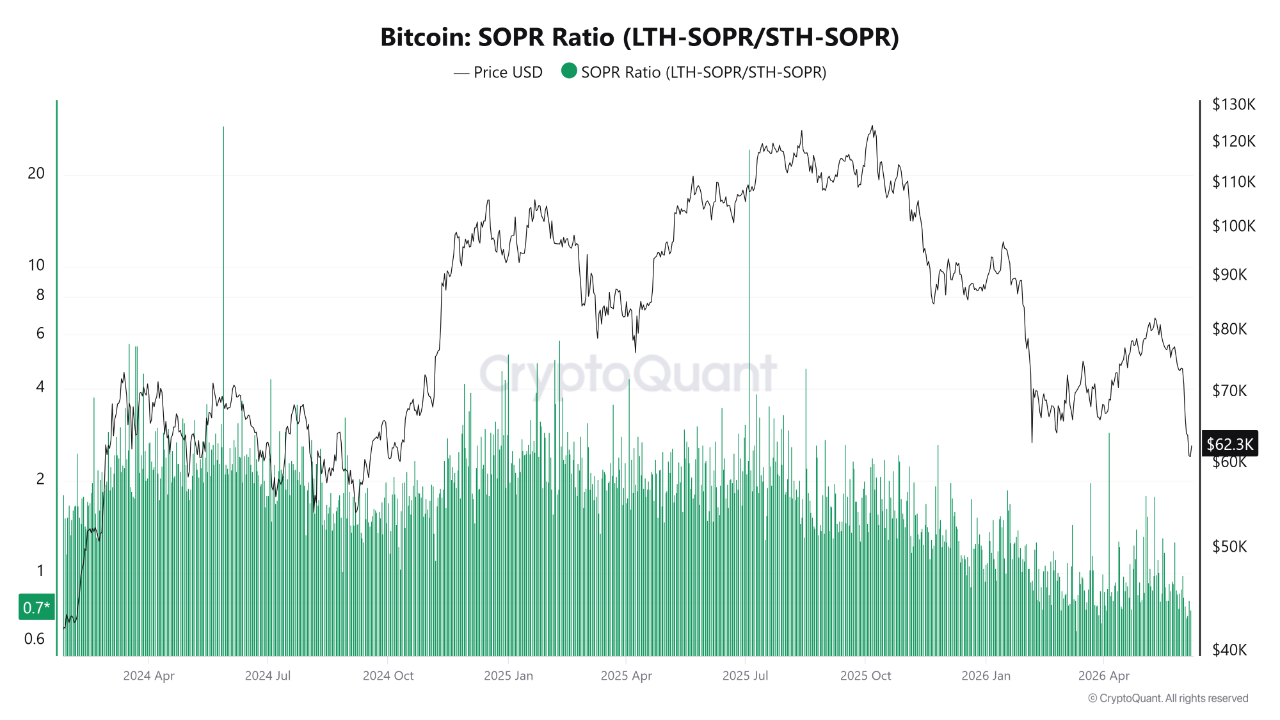
That change in behavior carries weight. When long-term holders stop selling into strength, one major source of sell-side pressure begins to ease.
Historically, this pattern has appeared during the later stages of market corrections. It does not confirm a bottom, but it does reflect a meaningful shift in holder sentiment.
Supply in Profit has also dropped to roughly 47%. That means more than half of all circulating Bitcoin is now held at a loss or near break-even.
In bull markets, this figure typically exceeds 90%. The current reading aligns closely with levels seen at the floor of previous bear cycles in 2018 and 2022.
Taken together, these two indicators suggest that speculative excess has largely been removed from the system. Investors who entered during peak euphoria have either sold or are sitting on unrealized losses. That kind of market cleanup has historically preceded recovery phases.
Why Bitcoin’s Price Decline May Not Signal a Structural Failure
Bitcoin is competing for capital against some of the most powerful investment narratives in global markets right now.
Artificial intelligence stocks and anticipated major technology IPOs are drawing liquidity away from crypto. That rotation is creating a demand shortage, not a collapse in Bitcoin’s fundamentals.
This distinction matters when reading the on-chain data. Bitcoin is approaching two historically important valuation benchmarks — the 200-week moving average and the Realized Price.
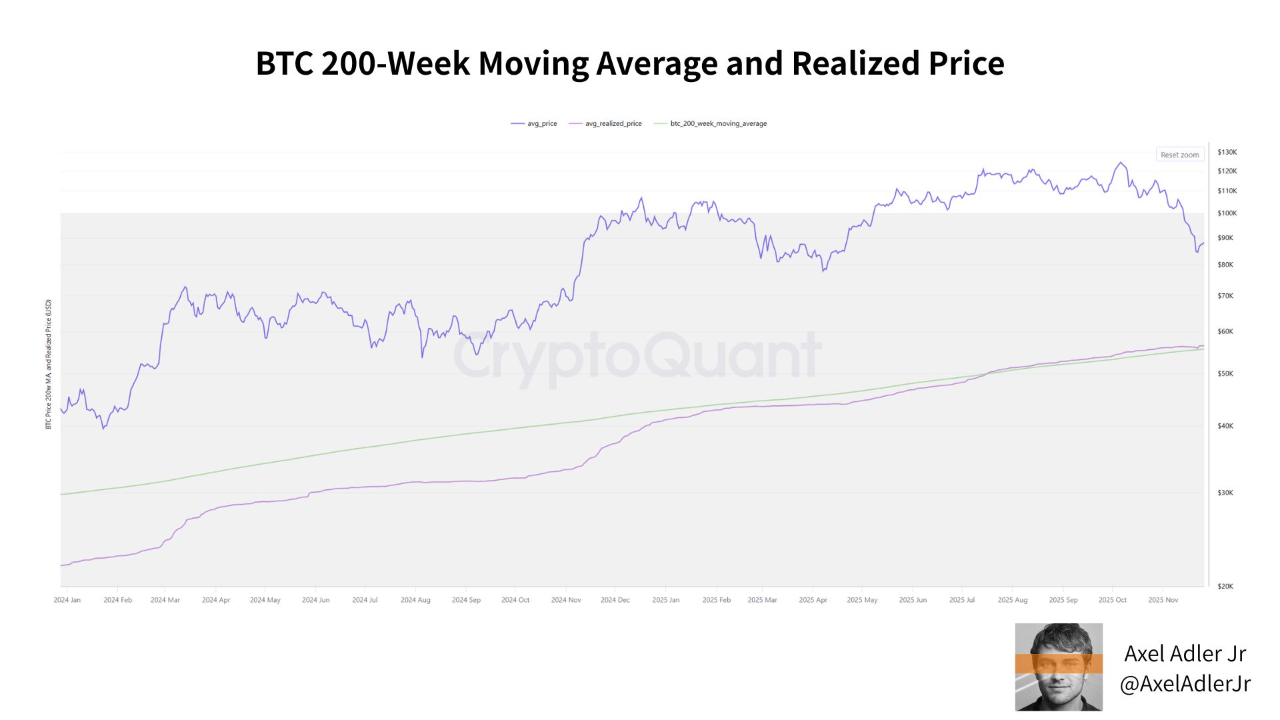
Both have acted as strong support zones during past downturns. Buyers who monitor these levels tend to treat them as favorable long-term entry points.
The convergence of these three signals — softening long-term holder profit-taking, a majority of supply in loss, and proximity to key valuation support — paints a consistent picture.
The market structure appears to be transitioning away from distribution and toward accumulation. Sentiment has moved from euphoria to measured caution.
Still, the bottoming phase is not yet confirmed. The next sustained move upward will depend on whether fresh capital returns to Bitcoin.
Until that rotation happens, the market remains in a critical testing zone — and on-chain data remains the clearest tool available for reading its direction.

