



Key Highlights
- Solana closed its first positive monthly candle in nearly a year following a rebound from the $60 level
- Technical indicators show monthly RSI breaking multi-year resistance while MACD nears bullish territory
- Large investor accumulated 285,503 SOL tokens valued at $28.82 million through Hyperliquid over recent weeks
- Daily chart golden cross formation suggests possible advance beyond $150 price level
- Network’s real-world asset ecosystem reached record $4.35 billion valuation with dominant memecoin trading share
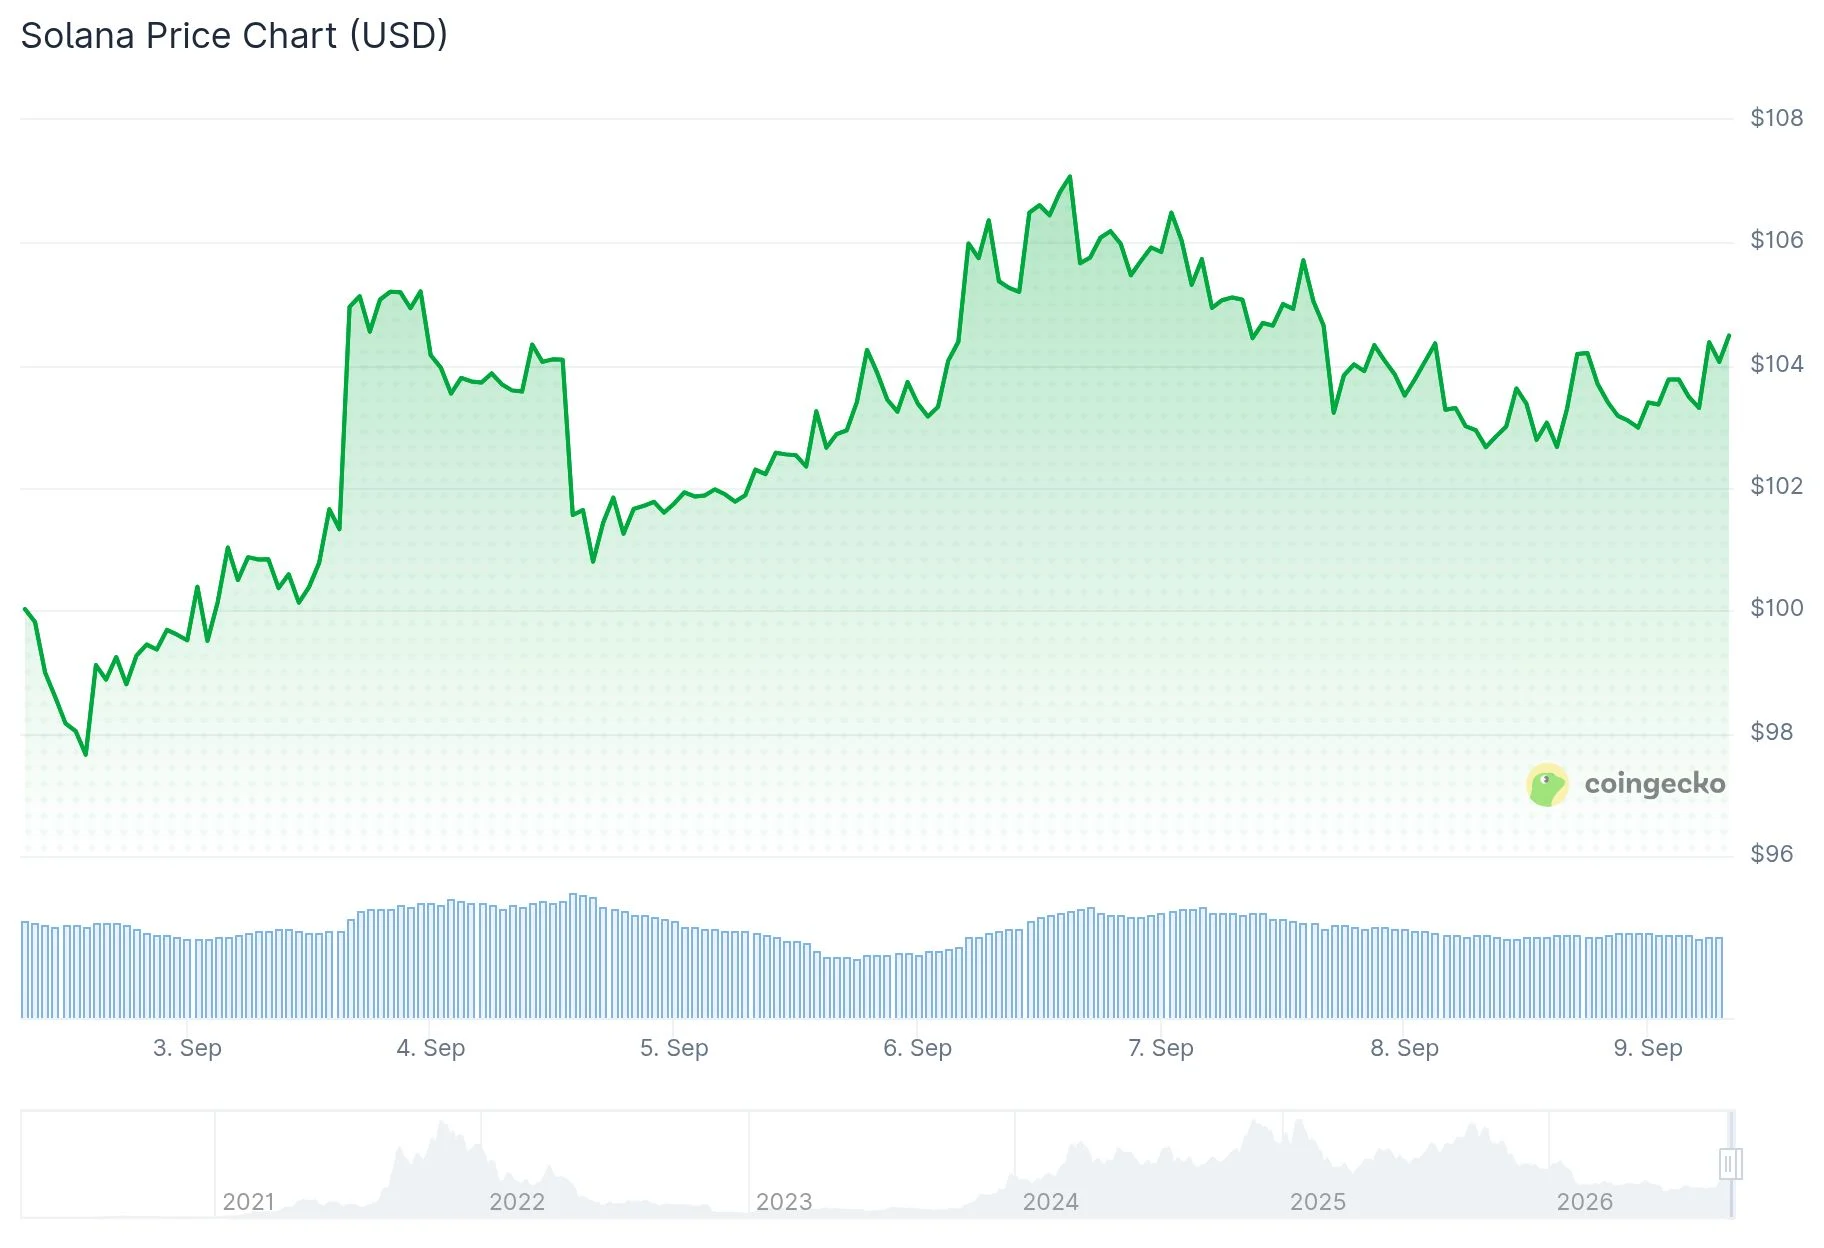
Solana (SOL) currently trades around $102, experiencing a 3% decline in the past day. However, the broader picture shows a strong 34.8% gain across the last month. Today’s trading activity has kept the token between $102.28 and $105.20.
Technical analysis reveals three significant developments on monthly timeframes. The second indicator to watch is the MACD, which appears ready for a bullish crossover pending confirmation. Additionally, the RSI indicator has successfully broken through a descending resistance line that had constrained price action for approximately 24 months.
Market analyst Ash Crypto shared observations on X: “$SOL is showing one of the most bullish setups in crypto right now. Closed its first green monthly candle in 10 months. Monthly MACD is about to cross bullish. Monthly RSI has broken a 2 year downtrend. Is SOL starting its major bullish reversal?” The commentary highlighted changing momentum without declaring a confirmed reversal.
The token previously reached levels above $200 before declining toward $60. Maintaining support between $60 and $80 remains crucial for sustaining the current recovery pattern. Breaking through and consolidating above $100 to $120 would add credibility to the bullish thesis.
Large-Scale Token Acquisition
Blockchain tracking data reveals that whale wallet HURDw executed a series of SOL purchases via Hyperunit’s hot wallet spanning three weeks. The accumulated position totaled 285,503 SOL with an approximate value of $28.82 million. The most substantial individual transaction involved 49,732 SOL, representing roughly $5.07 million.
These acquisitions were spread across numerous transactions instead of a single bulk order, taking place during SOL’s recovery phase from its bottom near $60.
Golden Cross Formation Suggests $150 Possibility
Technical analyst 0xSweep highlighted the emergence of a golden cross pattern on Solana’s daily timeframe. This technical signal appears when a short-period moving average rises above a longer-period counterpart.
0xSweep drew parallels to an earlier golden cross instance on the same chart, which preceded a 56.22% price surge that pushed SOL into the $250 territory. Extrapolating similar percentage gains from present price levels suggests a theoretical target exceeding $150 by October’s conclusion. This projection relies on historical pattern comparison rather than guaranteed forecasting.
The Solana network’s real-world asset sector achieved an unprecedented valuation of $4.35 billion, supported by more than 420,000 RWA token holders. Data from September 7 showed Solana commanding 67% of spot decentralized exchange memecoin trading volume among monitored blockchains, representing nearly triple Robinhood’s 23% market share.

